Economy
Inflationary Inflection Point or Temporary Blip?
The public is already aware of the disconnect between official data and individual experience, but as prices, even as measured by PCE, start to rise, anger at this egregious inflation fiction will grow.

In this article I look at the longer-term prospects for inflation in the US. The lockdown decline and subsequent recovery in GDP growth, together with the concomitant fall and rise in prices is already evident. Meanwhile, the forward-looking stock market continues to travel hopefully, anticipating the end of restrictions and a return to the new normal. The bond market, by contrast, may be starting to express fears that the largest peacetime stimulus in history might have longer-term inflationary consequences.
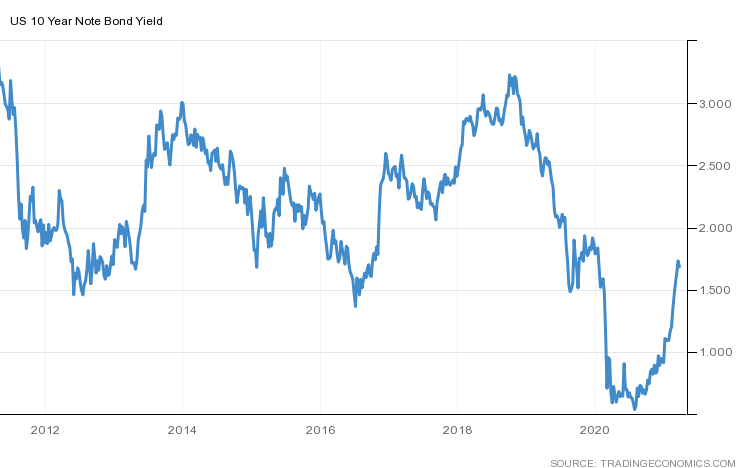
Since making all-time low yields in August 2020, US 10yr Treasury Bond yields have risen steadily, but, as the chart below reveals, only back to the depressed levels of H2, 2019 and mid-2016. Is this a post-lockdown correction or an inflection point, or is it too soon to say?
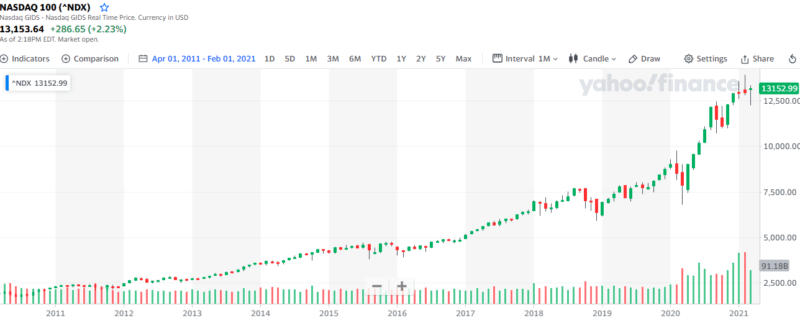
The high growth stocks which dominate the Nasdaq 100 index briefly took fright, in some cases retreating by more than 30%, but the broader index rapidly regained composure. As the next chart (22nd March) shows it is presently just 5.2% below its all-time high. Looked at over the past decade, one could be forgiven for thinking the recent retracement is simply some overdue profit-taking in an otherwise unblemished multi-year bull-market: –
The broader-based S&P 500 Index remains staunchly within striking distance of its all-time high made on 17th March. So, why is the financial press awash with talk of tightening despite assurances from Federal Reserve (Fed) Chairman Jerome Powell to the contrary? The main reason is a belief, especially among the ranks of the so-called bond vigilantes, that the combined monetary and fiscal stimulus which mitigated the immediate economic impact of the pandemic will, as the global economy rebounds, lead to structurally higher prices for goods and services.
‘Inflation is always and everywhere a monetary phenomenon in the sense that it is and can be produced only by a more rapid increase in the quantity of money than in output.’
Milton Friedman
When Friedman wrote about the variable lags between increases in the monetary base and inflation, it was an era of relatively stable velocity of monetary circulation. By contrast, over the past two decades that velocity has fallen steadily: –
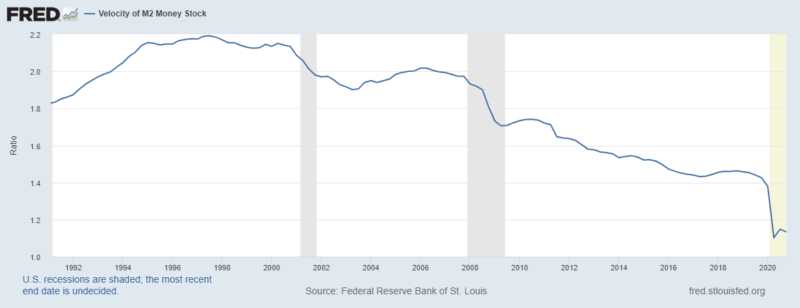
Bond yields may have risen but there is scant evidence of a rebound in the velocity of monetary circulation. The end of the lockdowns may see velocity return to its trend, but the trend has yet to turn; what factors could make this the inflation inflection point?
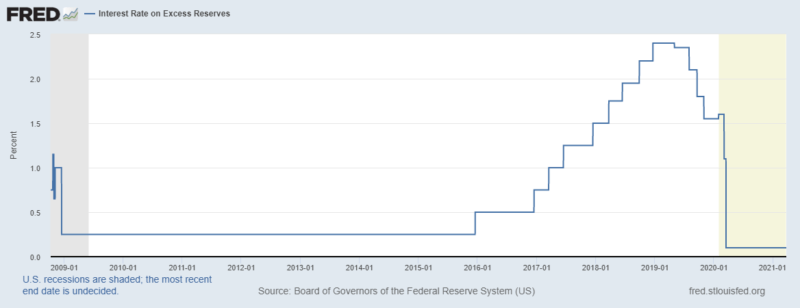
We need look no further than AIER’s Gregg van Kipnis who, on 17th March, published a fascinating analysis entitled Inflation Outlook: Likely Worse Than Expected. The author examines the reasons behind the absence of inflation, despite the excessively accommodative monetary policy of the last decade. He argues that a key factor was the introduction of IOER – interest on excess reserves held at the Fed – which effectively sterilised a large proportion of the newly created monetary balances. For a detailed explanation of the Fed policies – Why did the Federal Reserve start paying interest on reserve balances held on deposit at the Fed? Does the Fed pay interest on required reserves, excess reserves, or both? What interest rate does the Fed pay? from FRBSF is a good starting point.
Van Kipnis argues that the declining velocity of circulation in the face of rising money supply is also a function of the lack of opportunity in the real economy. This anaemic investment environment is also reflected in the flatness of the US yield curve. In the chart below, van Kipnis shows the closeness of the relationship between the velocity of circulation and falling bond yields: –

The FOMC statement from March 17th gave upward revisions of their GDP and inflation (PCE) forecasts for Q4 – to 6.5% and 2.2% respectively, but reiterated that monetary policy remains unchanged: –
The Committee decided to keep the target range for the federal funds rate at 0 to 1/4 percent and expects it will be appropriate to maintain this target range until labor market conditions have reached levels consistent with the Committee’s assessments of maximum employment and inflation has risen to 2 percent and is on track to moderately exceed 2 percent for some time. In addition, the Federal Reserve will continue to increase its holdings of Treasury securities by at least $80 billion per month and of agency mortgage‑backed securities by at least $40 billion per month until substantial further progress has been made toward the Committee’s maximum employment and price stability goals.
This echoes a recent speech – How Should We Think about Full Employment in the Federal Reserve’s Dual Mandate? – given by Fed Governor Lael Brainard: –
Inflation remains very low, and although various measures of inflation expectations have picked up recently, they remain within their recent historical ranges. PCE (personal consumption expenditures) inflation may temporarily rise to or above 2 percent on a 12-month basis in a few months when the low March and April price readings from last year fall out of the 12-month calculation, and we could see transitory inflationary pressures reflecting imbalances if there is a surge of demand that outstrips supply in certain sectors when the economy opens back up. While I will carefully monitor inflation expectations, it will be important to see a sustained improvement in actual inflation to meet our average inflation goal.
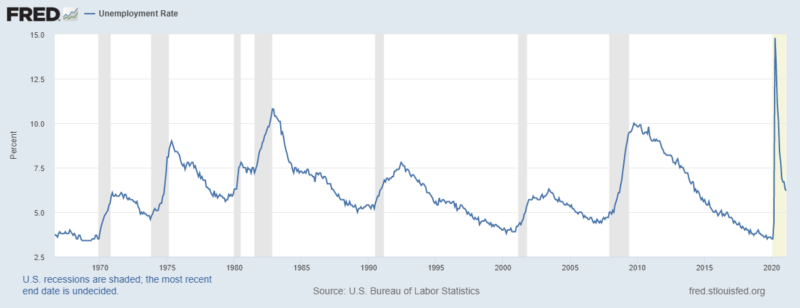
This speech is principally concerned with that other element of the Fed’s dual mandate, the maintenance of full employment. They do not specify a target for unemployment but consensus suggests 3.5% should suffice – that is a level reached in September 2019 and February 2020: and prior? Not once since December 1969: –
Fed guidance suggests that they intend to be reactive rather than proactive where inflation is concerned. Papers, such as – Did the Federal Reserve Anchor Inflation Expectations Too Low? – simply reinforce this impression. They anticipate a sharp economic recovery once vaccinations permit businesses to reopen. Once the bottlenecks ease and the wave of pent-up demand has subsided, however, they fear a further slowdown. The yield switch over between 2yr, 5yr and 10yr Treasury Inflation-Protected Security (TIPS) reflects this view: –

The breakeven inflation shown in the chart above is calculated by taking the yield on a conventional bond minus the yield on an inflation-indexed bond of the same maturity. For further insight into this topic – The Persistent Compression of the Breakeven Inflation Curve – provides a wealth of information. Here are the authors’ conclusions: –
…we document two striking properties of the forward breakeven inflation curve over the last seven years: (1) a persistent level shift down and (2) cross-sectional compression. Going forward, it will be interesting to see if these features of the markets change, perhaps because of investors’ responses to the FOMC’s new flexible average inflation targeting framework, and what that implies for our understanding of this unprecedented behavior.
Perhaps the Fed is winning the war of words, but in – Bond markets are shrugging off inflation fears, but what do they know that we don’t? – The Peterson Institute cautions against relying on the predictive power of inflation breakevens.
Meanwhile in conventional Treasury securities bearish speculation is rife – short interest briefly reached a 20-year record in early March: –
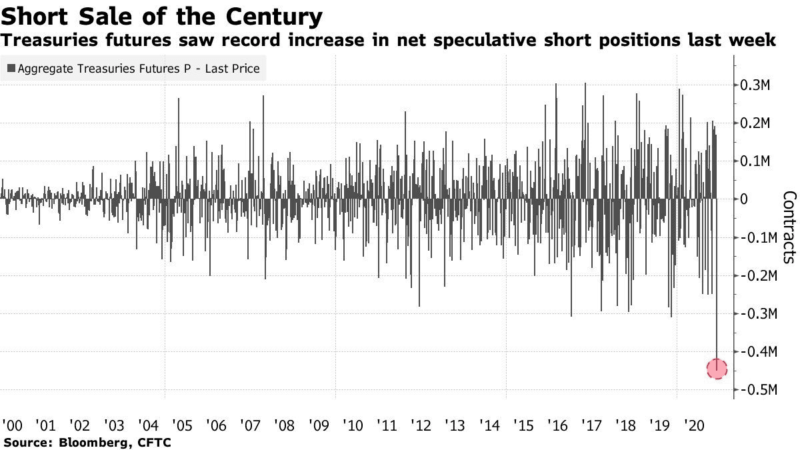
The repo rate for US 10yr on-the-run T-Bonds traded briefly at -4.25% – in other words borrowers of securities, such as hedge funds, were prepared to lend their cash for free and pay an additional borrowing fee of 4.25% in order to secure 10yr T-Bonds to sell short. For a more detailed explanation of repo rates, this 2004 New York Fed paper – Repurchase Agreements with Negative Interest Rates – may be of interest. What seems evident is that long dormant inflation expectations may be beginning to rise.
Van Kipnis argues that the low level IOER (0.10%) will help to underpin a structural increase in the velocity of circulation: –
Nonetheless, despite Chairman Powell’s pronouncements, there is a tightening of monetary conditions due on March 31st as the temporary change to the Fed’s supplementary leverage ratio (SLR) for bank holding companies expires. This temporary measure has permitted banks to exclude Treasury securities and deposits from SLR calculations for the past year. From April banks’ capacity to provide credit and liquidity to financial markets will be reduced. This New York Fed, Liberty Street post – Did Dealers Fail to Make Markets during the Pandemic? – provides more information.
Beyond Normalisation
Looking beyond the current recovery there are two forces which persuade me that the inflation genie may have emerged from its bottle. Firstly the persistent official under-measurement of inflation. This is most noticeable in US housing costs and healthcare but is evident, to a lesser degree, in education: –
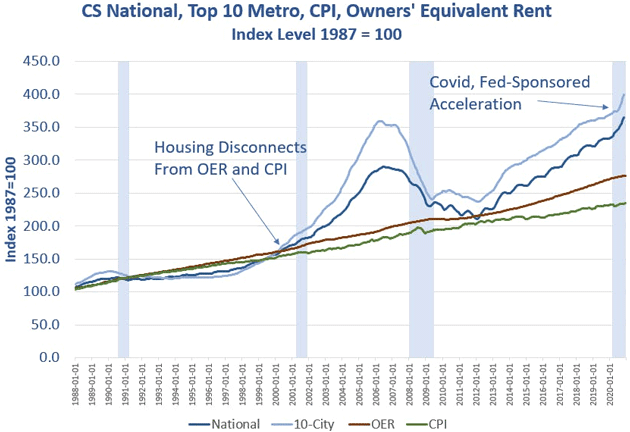
With housing we see a divergence which has been widening since 2000 and has accelerated since 2012.
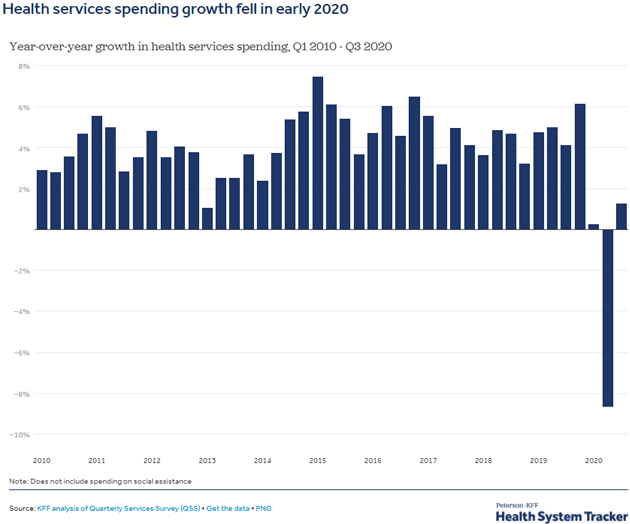
Meanwhile, as the US population ages, healthcare costs have risen faster than implied by CPI or PCE: –
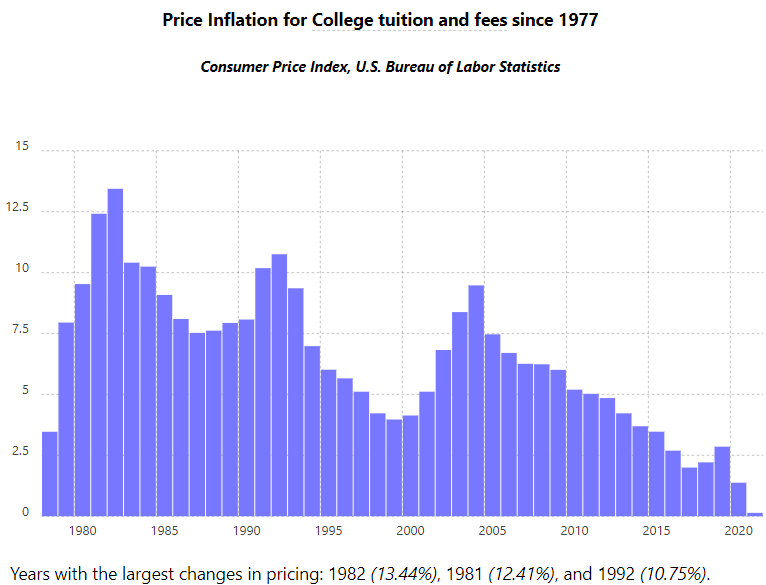
The chart below shows college tuition inflation since the 1980’s; last year’s decline was primarily due to the lockdowns: –
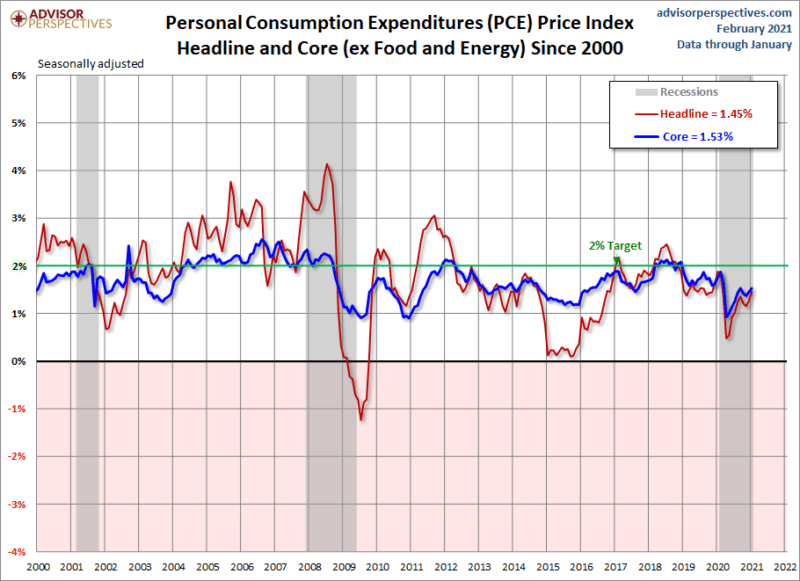
As the next chart reveals, the systemic under-measurement of inflation inherent in both the CPI and PCE measures permits the Fed to justify setting policy rates too low: –
This chart from Shadow Stats shows the way inflation measurement, compared to the official method used in the 1980’s, has diverged: –
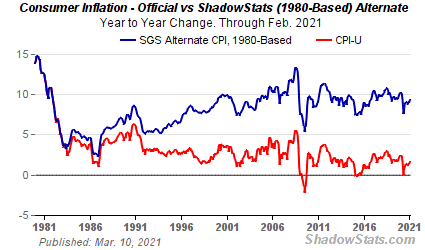
A full explanation of the methodology used can be found here. The public is already aware of the disconnect between official data and individual experience, but as prices, even as measured by PCE, start to rise, anger at this egregious inflation fiction will grow.
The Demographic Twist
The second factor which will support higher inflation is the aging of the population of both developed and developing countries. Writing in September 2020 Charles Goodhart and Manoj Pradhan provided a precis of their new book. The article, entitled, The great demographic reversal and what it means for the economy – begins by addressing the outlook for China, concluding that its greatest contribution to global growth is already past, since the size of its working age population has begun to decline. They go on to observe that in countries with a shrinking working age population: –
The great demographic reversal will lead to a return of inflation, higher nominal interest rates, lessening inequality and higher productivity, but worsening fiscal problems, as medical, care and pension expenditures all increase…
The authors predict that output growth will decline as the ratio of workers to retirees diminishes. Any increase in longevity without significant breakthroughs in healthcare will be a burden on the affected old, their families and the state. If fertility rates continue to decline, carers, already in short supply, will be in even higher demand. The authors are convinced that the combination of these demographic forces with the continued reversal of globalisation will presage the return of structurally persistent inflation. This combination of cost-pull and price-push inflation will cause interest rates to rise, but not necessarily as fast as inflation. The inflation will also be felt unevenly across society, exacerbating political polarisation.
Goodhart and Pradhan focus specifically on the fortunes of the UK economy, concluding: –
From 1750 until 1950 inflationary expectations, and nominal and real interest rates, remained roughly constant, in the UK at least, while inflation was a function of occasional wars and the vagaries of harvest. After the 1950s there was a strong upwards trend in inflation, inflationary expectations and nominal interest rates (1950 – 1980), followed by an extraordinary downwards trend in inflation, inflationary expectations and both nominal and real interest rates (1980 – 2020). The earlier trend can be ascribed to a doomed, but well intentioned, attempt to keep unemployment below its rising natural rate, with the monetary regime allowing that to happen. We ascribe the subsequent downwards trend to underlying demography and globalisation factors. Given the expansionary intent of monetary policies, it is hard to claim that such disinflation was a monetary phenomenon. But in that case the forthcoming reversal of the previous demographic and globalisation trends should lead to a revival of inflation and nominal (but not necessarily real) interest rates.
The US may have better demographics than many developed nations but the trend towards individual spending rather than saving will still have inflationary consequences.
Since 2008 we have seen the shortening of global supply chains, and protectionist policies have stalled the process of globalisation. Immigration has become more contentious as the nature of work has become more transitory and older workforce participation has risen: –
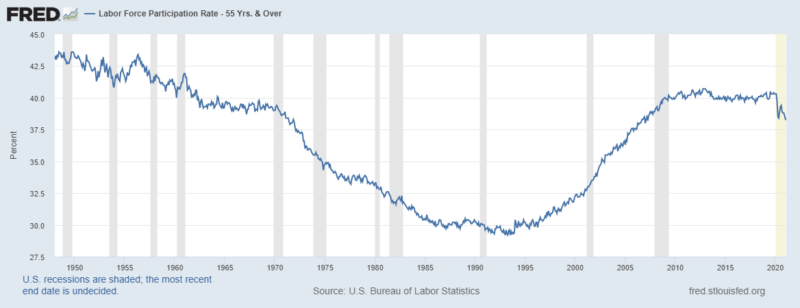
For two decades until 2010 older workers delayed retirement. Since 2010 their cohort has marked time, looking ahead, however, they cannot indefinitely postpone the inevitable.
…But all the clocks in the city
Began to whirr and chime:
‘O let not Time deceive you,
You cannot conquer Time.
W.H. Auden
Conclusion
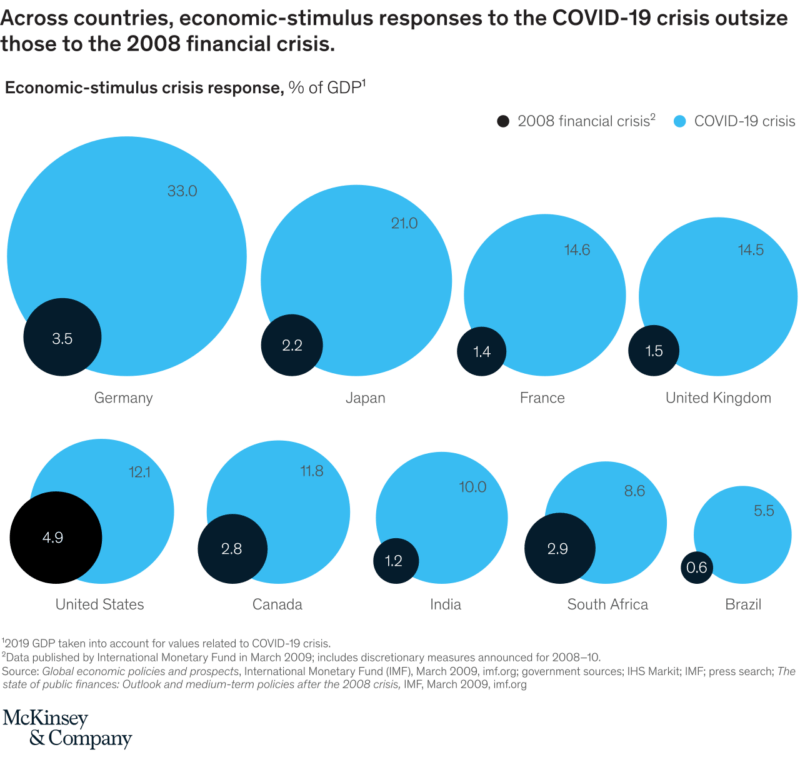
The question that I asked at the beginning of this article was whether or not we have reached an inflation inflection point. My answer is a qualified ‘yes,’ but this is as much a function of the scale of the fiscal and monetary response to the lockdowns as it is a turning point. For a brilliant (Austrian Economic) analysis of the global economic impact of the lockdowns, Jesus Huerta de Soto’s – Economic Effects of Pandemics – is a tour de force. From a monetary perspective, however, this infographic, showing a comparison between the scale of 2020 and the response to the Great Financial Recession, is instructive: –
Demographic forces are definitely at work but they will take time to become apparent. The fastest-aging country, Japan, continues to be the experimental petri dish of central bank policy – their romance with yield curve control, pivoting around a 10yr JGB yield of zero, has not yet palled. How the Fed Managed the Treasury Yield Curve in the 1940s – tells the story of the US experiment with something similar between mid-1942 and February 1950.
The Biden administration is preparing a Green New Deal along the lines of FDR’s policy of the 1930’s. These proposals spell higher regulatory costs for traditional energy producers: in this more protectionist era, these measures will be inflationary. However, if the Fed continues to purchase $120bln or more in Treasury bonds and mortgage-backed securities monthly they may succeed in stalling the rise in long-term yields. The yield curve will remain too flat and the malinvestments, which emanate from an artificially low long-term cost of funding, will continue to proliferate. If bond yields cannot rise, the stock market will remain supported unless stagflation sets in. Should that transpire, the Fed will need to decide whether to ignore inflation and increase monetary stimulus, including the purchase of ETFs and common stock, in order to maintain full employment, or ‘hold’ and witness a politically unpalatable clearing of both the stock and bond market.


Economy
McMaken: The Fed’s Inflation Is Behind the Supply-Chain Mess
… the idea that supply chain problems are “driving inflation” gets the causation backward.

It seems supporters of the Biden Administration finally settled on a narrative they like for explaining away supply chain shortages.
Here’s the administration’s talking point: the US economy is rolling along so well that Americans are demanding huge amounts of goods. That’s overwhelming the supply chain and causing the back-ups roiling America’s ports and logistic infrastructure.
For example, Transportation Secretary Buttigieg this month declared “Demand is up … because income is up, because the president has successfully guided this economy out of the teeth of a terrifying recession.”
Similarly, White House spokeswoman Jen Psaki told reporters supply chain problems are occurring because “people have more money … their wages are up…“we’ve seen an economic recovery that is underway…”
This position has been mocked by a number of conservative politicians—including Senator Ted Cruz—and commentators who find this to be an absurd assumption.
Yet, the administrator’s defenders aren’t totally wrong. As Mihai Macovei showed earlier this month, the global volume of trade and shipping volume in 2021 have actually exceeded pre-pandemic numbers. For example, in the port of Los Angeles, “loaded imports” and “total imports” for the 2020-2021 fiscal year (ending June 30, 2021) were both up when compared to the same period of the 2018-2019 fiscal year.
In other words, it’s not as if nothing’s moving through these ports. In fact, more is moving through them than ever before. That suggests demand is indeed higher.
But why is it higher? It some ways, it’s true that, as Psaki says, people have more money.
But that’s where the veracity and usefulness of Biden’s defenders end in explaining the problem.
Much of the answer can be found in monetary inflation. Obviously, Joe Biden hasn’t “successfully guided the economy” through anything, but it is accurate to say that people have more money in a nominal sense. Wages are up nominally. After all, if we look at the immense amount of new money created over the past 18 months, we should absolutely expect people to have more money sloshing around. But this also means a lot more pressure on the logistical infrastructure as people buy up more consumer goods.
In other words, the idea that supply chain problems are “driving inflation” gets the causation backward. It’s money-supply inflation that’s causing much of the supply chain’s problems. Not the other way around.
After all, since February 2020, M2 has increased from $15.2 trillion to $20.9 trillion in September 2021. That’s an increase of 35 percent. Yes, some of that has been kept within the banking system through the Fed’s payment of interest on reserves, but a lot of it clearly has entered the “real economy” through stimulus payments, unemployment insurance, and federal deficit spending in general.
Originally, the public was saving a lot of that stimulus and bailout money, with the personal savings rate hitting historic highs of over 25 percent. But this past summer the savings rate collapsed again, and as of September is back under eight percent. The public is now flooding the economy with its former savings.
The American appetite for spending on consumer goods hasn’t gone away. Yet, there are many reasons to suspect this spending spree is unsupported by actual economic activity, and in a phenomenon of monetary inflation.
For example, today’s tsunami of spending raises questions when we consider there are still about five million fewer people working in the American economy than was the case in early 2020. That means fewer people being paid wages. Without monetary inflation, an economy with millions of fewer workers suggests there should be less spending.
Additionally, spending increases when the public suspects that inflation is going to increase. That is, if there is perception the value of money will decline, the demand for money will decline also. As Ludwig von Mises noted: “once public opinion is convinced … the prices of all commodities and services will not cease to rise, everybody becomes eager to buy as much as possible and to restrict his cash holding to a minimum size.”
That means more spending. This phenomenon is already clear in home prices and grocery prices. The public may suspect rising prices are here to stay. Meanwhile, the Consumer Price Index—a very limited measure of goods-price inflation—is nonetheless near a 35-year high. That means now’s a good time to spend.
With 2020’s panic-induced saving subsiding, people are now wondering if their savings produce any returns. But ordinary savers are surely now remembering that the interest returns from savings right now are next to nothing. Thanks to the central bank’s ultra-low interest rate policy, we live in a yield-starved world. That’s OK for hedge funders who can participate in carry trades and other high-yield forms of investment. But for regular people they’re stuck with interest rates that don’t keep up with price inflation. So it makes more sense to spend dollars rather than save them.
So, Biden’s people are correct in a certain sense that people have “more money” and that “demand is up.” With federal spending hitting historic highs—and half of it is deficit spending that’s being monetized—we should expect people to have “more money.” This is just what we would expect in an inflationary environment. We should expect demand for everything (but money) to be up.
The question, however, is how much of this windfall will continue in real, inflation-adjusted terms. It’s too early to tell, although we can also see that inflation-adjusted median earnings collapsed 6.3 percent, year over year, during the second quarter of 2021. We can see that real GDP growth has dramatically slowed.
But at least as far as the third quarter is concerned, it’s fairly clear the US was—and likely still is—in the midst of an inflationary boom. But how long will it last?
Economy
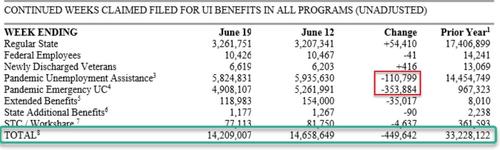
There Are Still Over 14 Million Americans On Some Form Of Government Dole
… we remind readers of the gaping chasm between those still claiming some form of pandemic-related unemployment benefit and the record number of job openings in America currently…

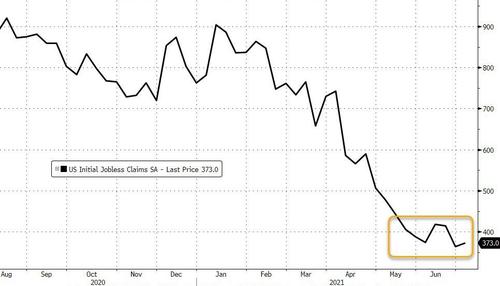
Initial jobless claims hovered at post-COVID-lockdown lows but were disappointing at 373k – well above the 200k-ish norms of pre-COVID
Source: Bloomberg
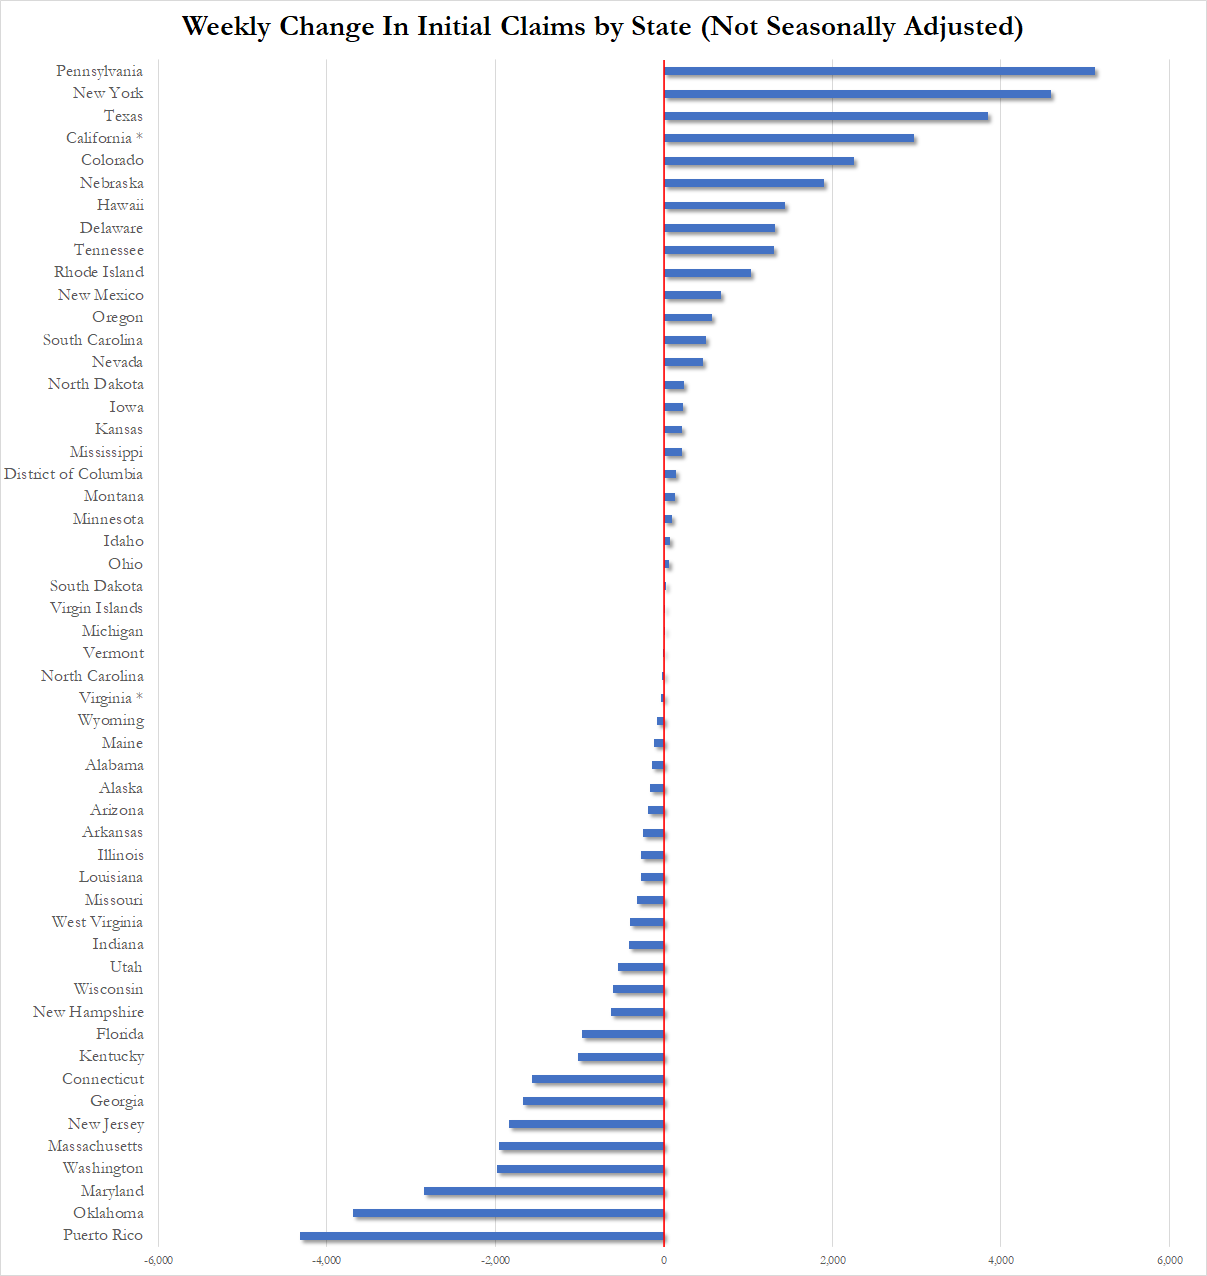
Notably, California and Virginia ‘estimated’ their jobless claims last week and Pennsylvania continues to swing wildly from week to week…

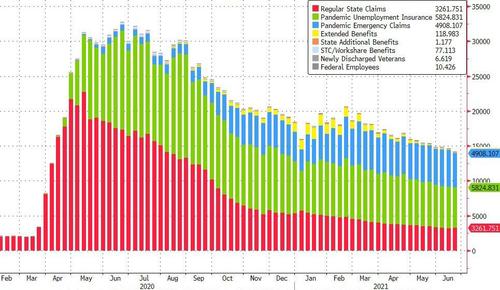
But, while the picture is improving overall, we should still remember that there are over 14 million Americans still on some of government dole…
Source: Bloomberg
We do note that 460k Americans dropped off the pandemic emergency aid rolls…
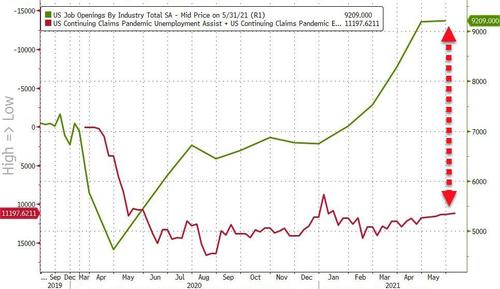
Finally, we remind readers of the gaping chasm between those still claiming some form of pandemic-related unemployment benefit and the record number of job openings in America currently…
Source: Bloomberg
Tick-tock on those benefits.
Economy
The Fed in a Box Part 2: They Cannot End Quantitative Easing
If inflation doesn’t slow in the coming months, the Fed may be forced to step in.
- If the Fed tapers QE, it may reveal waning appetite for long-term treasuries
- The Treasury may have used its cash balance reserve to anchor inflation expectations
- If inflation persists, the Fed may have to increase rather than decrease QE
Note: By definition, inflation is an expansion of the money supply. In this article, inflation will be used interchangeably with rising prices (usually as a result of money supply expansion)
Introduction
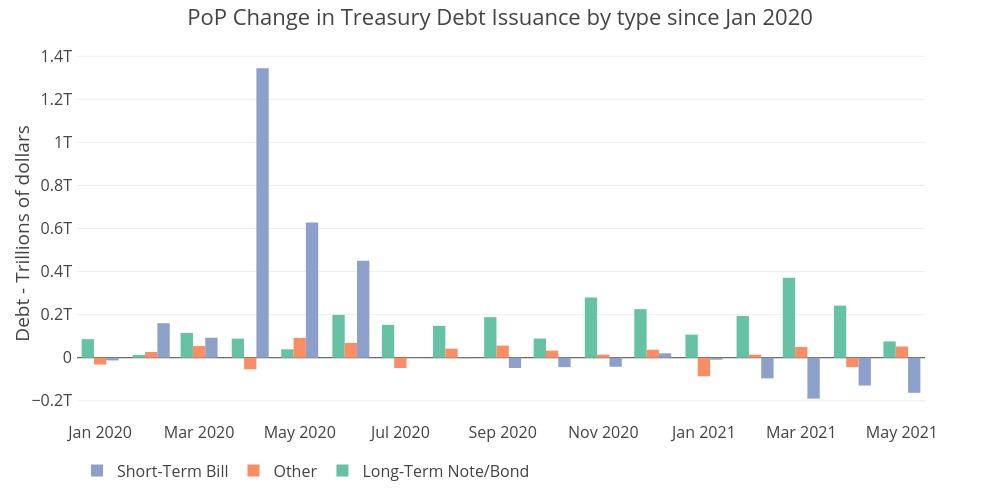
When the economy was shut down in March 2020, the government responded with massive fiscal and monetary support. The fiscal stimulus totaled $4T+ in relief packages. All of this spending was paid for with debt issued by the Treasury. The Treasury mostly issued short-term debt. With rates being held at zero by the Fed, and strong demand for short-term debt, it made sense to quickly raise cash using Treasury Bills as interest-free loans.
The Fed monetary policy was two fold, slash short-term rates to zero and inject $1.5 trillion into the long-term debt treasury market. The effect was to bring down interest rates across the entire yield curve. After the initial debt binge, QE went on auto-pilot, with the central bank buying about $80B a month in long-term debt (plus another $40B in Mortgage debt). Over the last year, the Treasury has continued to issue long-term debt, averaging more than the $80B the Fed has been buying. This has caused long-term rates to rise.
All of this fiscal and monetary stimulus is not without cost. Historically this type of activity almost always leads to higher inflation. The Fed may have recently indicated it wants higher inflation, but this is not true. This stance simply provides cover for them to not act in the face of rising prices. To actually fight inflation, the Fed would have to increase short-term rates above the rate of inflation. Part 1 of this series went into detail about how US short-term debt has doubled from $2.5T to $4.5T. This makes even small changes in short-term rates an immediate risk to the federal government, not to mention the much higher rates needed in a true inflation fight.
In theory, the Fed could leave short-term rates at 0% while ending QE and even shrinking its balance sheet. This would push long-term rates up to combat inflation. In the short/medium term the Treasury can mathematically handle higher long-term rates because it takes time for the higher rates to work their way through long-term debt. See the chart below that shows how the last tightening cycle worked its way through the average interest rate across debt instrument. Specifically, look at Notes compared to Bills. The average weighted interest rate on Bills moved very quickly where the rate on Notes barely had time to increase before rates dropped again.
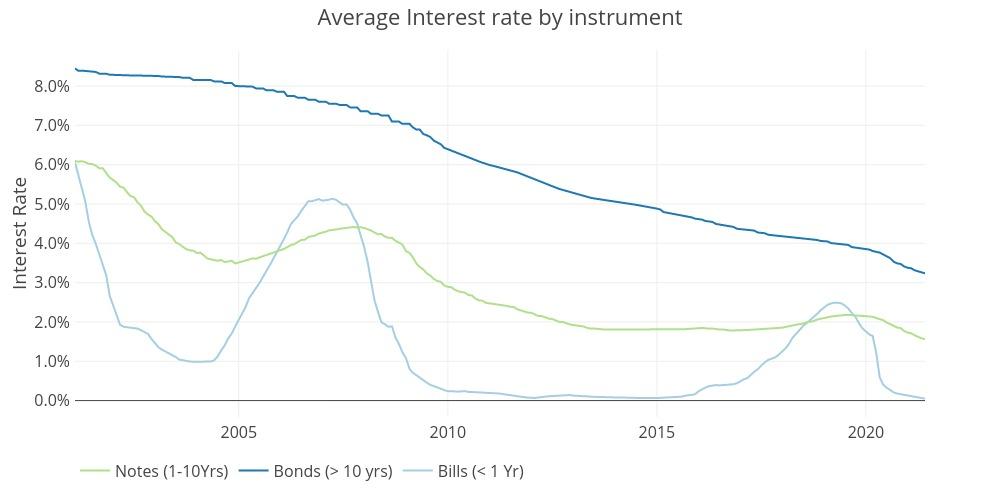
Source – Treasurydirect.gov
Although the Treasury could handle rising long-term rates (even if the economy and mortgage market cannot), the Fed has another problem. Rising long-term rates send an important message: rising inflation expectations. While inflation is first and foremost a result of monetary policy, higher inflation expectations quickly exacerbate the problem. This is why the Fed has been messaging they are OK with higher inflation and also why they have been pounding the table that inflation is transitory. They need to keep inflation expectations low! If inflation expectations were to rise, especially at this critical juncture, it would be game over for the Fed, as they would have to raise short-term rates (devastating the Treasury and economy) in order to save the dollar and squash inflation.
With the economy opening up in March of this year, things were getting very precarious as inflation was rapidly rising along with surging long-term rates. Remember that rising long-term rates indicate rising inflation expectations. This could cause transitory inflation to be much less transitory.
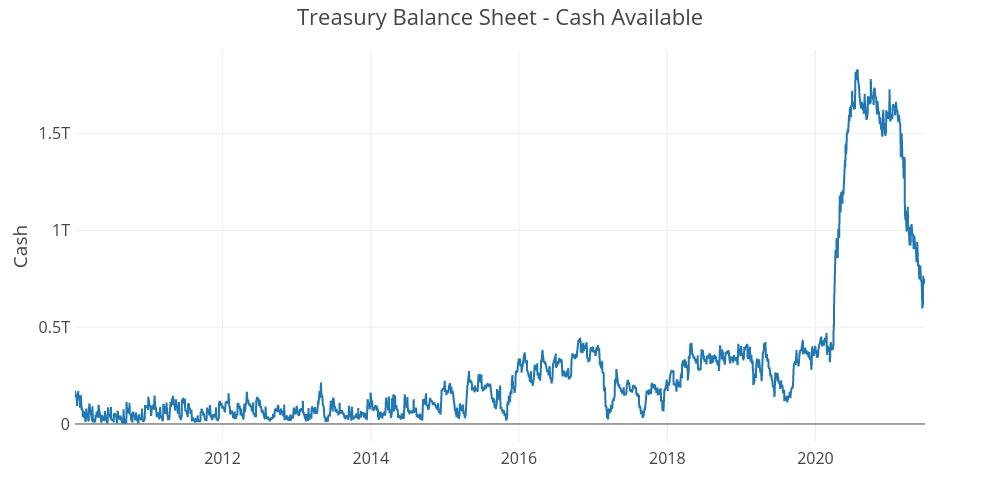
In summer 2020, the Treasury issued enough debt to build up a significant cash reserve. In response to rising long-term rates in Q1 2021, it appears the Treasury strategically used its cash reserves to slow down the issuance of long-term debt. With total short-term debt outstanding already so high, the cash balance gave the Treasury ammunition to decrease debt issuance just as a $1.9T stimulus bill was passed and inflation was set to explode higher. This would have been perfect timing to support the Feds narrative that inflation is transitory to keep expectations from snowballing out of control.
If inflation doesn’t slow in the coming months, the Fed may be forced to step in. With the Treasury poised to issue more debt, it can no longer rely on its one-time use of excess cash reserves. This will put more pressure on the Fed to clamp down long-term rates by increasing rather than decreasing QE. Yes, the Fed may decide to print more money (leading to higher prices) to fight rising inflation expectations (higher long-term interest rates).
Understanding recent fiscal and monetary maneuvers
Last year, when the pandemic hit, the US Government started spending trillions of dollars. Massive spending plans were approved in the name of stimulus and COVID relief. Because the government does not have much money on hand, and taxes cannot quickly be raised, the Treasury issued trillions in debt. The markets can easily absorb short-term US Treasury Bills, so when the Fed abruptly cut rates to 0%, the Treasury responded by issuing short-term debt to the tune of $2.4T from March to June 2020. See figure 1 below.
Source – Treasurydirect.gov
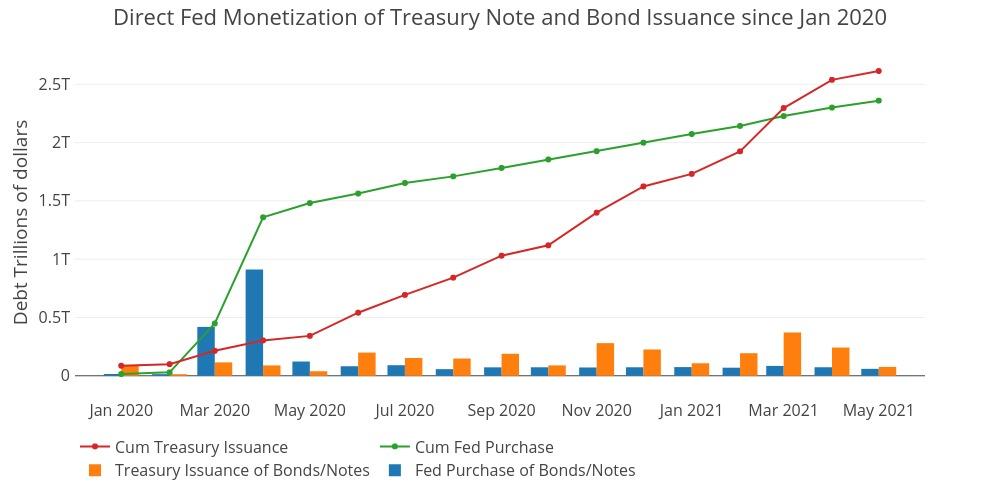
In tandem, the Fed bought up trillions of dollars in US Debt, but the Fed was buying on the long end of the curve while the Treasury was issuing debt on the short end. This caused long-term rates to collapse. The Fed purchased enough long-term debt to absorb more than a year’s worth of long-term debt issuance. The chart below shows how the month over month and cumulative change in the Feds balance sheet compared to the Treasury Debt Issuance of long-term notes and bonds.
Source – Treasurydirect.gov
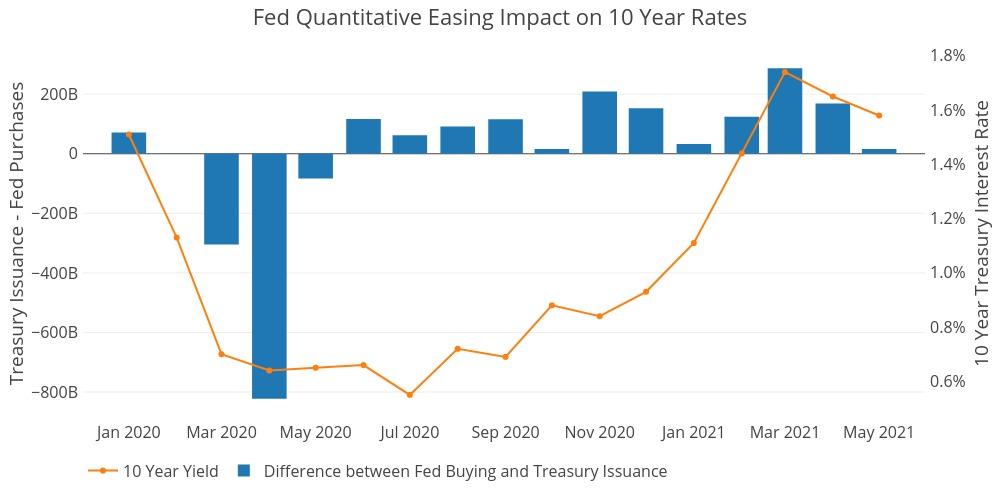
This action by the Fed had a massive impact on long-term rates. The chart below shows the difference between the two bars above, specifically the difference in Fed Buying and Treasury issuance of long-term debt for each individual month since Jan 2020. These values are not cumulative. The right Y-Axis shows the month-end interest rate of the 10-year bond. Looking at this chart shows something extremely clear: When the Fed buying exceeds debt issuance, rates are flat or falling; however when long-term debt issuance surpasses the Fed’s buying, rates rise.
Source – Treasurydirect.gov
The impact of the Fed can first be seen as interest rates fell from 1.5% to .6% during the initial buying spree. After the initial burst, the Fed put QE on auto-pilot, buying “only” $80B a month in long-term Treasuries. However, because the Treasury was issuing more than $80B a month as depicted by the positive bars starting in June 2020, interest rates started rising.
This trend started to accelerate in November of 2020, as long-term debt issuance was outpacing Fed Buying by around $200B. Things really started to escalate in the first quarter of 2021 as Treasury Debt issuance surpassed Fed buying by $286B in March right as interest rates were crossing above 1.7%.
Then, suddenly, long-term debt issuance started falling in April and was almost even with Fed buying in May. This consequently led to a fall in long-term rates, which are now hovering back around 1.5%. How did this happen just as Biden was pushing through a $1.9 stimulus package? Unlike 2020, when short-term debt issuance was used to plug the gap, Figure 1 above shows that short-term debt issuance was actually turning negative (blue bars).
What gives?
One look at the Treasury Cash Balance sheet in the chart below tells almost the entire story. This was first highlighted by a SchiffGold article published June 16. The chart below shows a massive surge in cash reserves by the treasury last year. Since March of this year, the cash balance has plummeted by over $1T.
Source – Treasurydirect.gov
Inflation Expectations
Why such a massive and sudden drawdown in the cash balance? In truth, there could be lots of reasons, but it does seem extremely sudden. One would think the Treasury, led by Yellen, would be very deliberate and thoughtful about how to use up $1T+ in dry powder. For the past 3 months, the Fed has been shouting from the rooftops that inflation is transitory. At the June FOMC press conference, Powell stood up and explained how long-term inflation expectations remain well-anchored. A proxy for inflation expectations is long-term interest rates.
Had interest rates continued to rise similar to the recent trajectory (climbing from .8% in Nov to 1.7% in March), this would have been a difficult narrative to push. The Fed needs inflation expectations to remain in check or else inflation will be anything but transitory. Thus, the perfect time for the Treasury to pause issuance of long-term debt would be April-June 2021 just as the economy is re-opening and the Fed is forecasting inflation to be at its worst before coming back down.
While this is speculation, it would be a very strategic move from both Powell and Yellen. Regardless of the intention though, the problem is that the Treasury has now spent its large cash balance. It could return to the short-term debt market, but the outstanding balance is still sitting above $4T (see part 1). It needs to be converting that short-term debt to long-term debt while long-term interest rates are still low and the Fed is still buying. But the Fed is simply not buying enough at $80B to convert all that debt!
If inflation persists beyond a few months, then interest rates are going to rise in a hurry as the market demands higher rates. Adding fuel to the fire will be the Treasury debt issuance overwhelming the $80B Fed buying as it did from November to March.
Then what?
Who is absorbing the long-term debt to keep interest rates from returning to the upward trajectory from Aug 2020 – Mar 2021?
International creditors have had little appetite for US Debt lately. The chart below shows the total outstanding debt held by foreign governments. In the past 15 months, while the Treasury has issued over $4T in new debt, the net amount bought by foreign governments is close to zero.
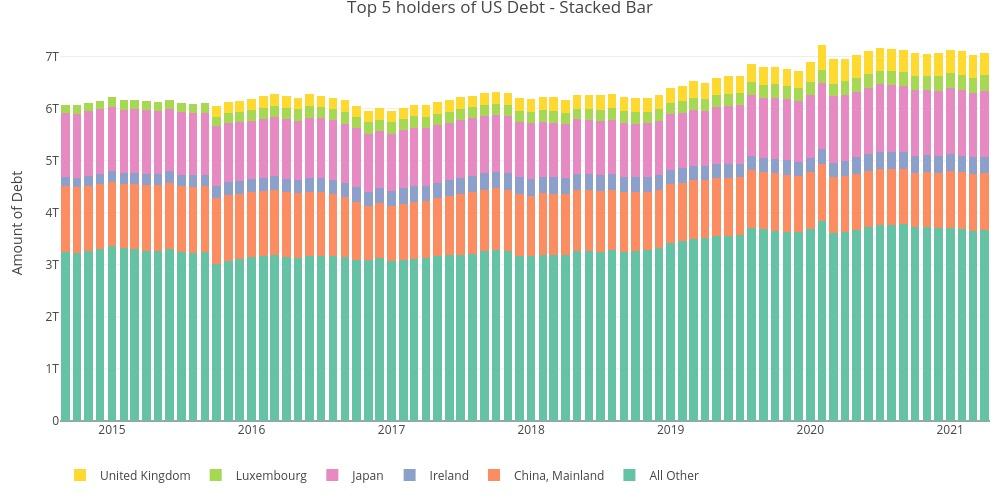
Source – https://ticdata.treasury.gov/Publish/mfh.txt
To zoom into the exact amount of change since the massive debt issuance, see the chart below. In total, foreign creditors have absorbed $120 billion of $6T+ or less than 2% of total issuance!
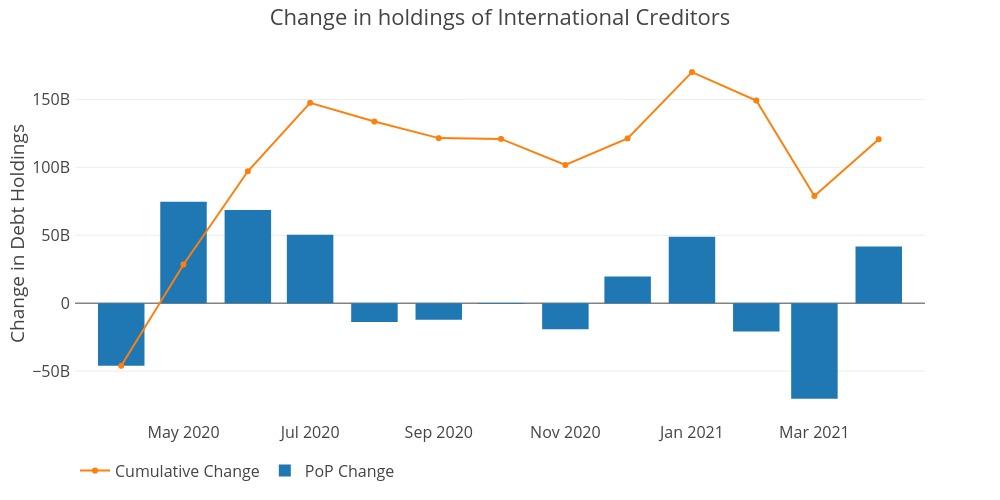
Source – https://ticdata.treasury.gov/Publish/mfh.txt
How are rates going to stay low if the Fed keeps the treasury buying cap at $80B? The Treasury will have to issue more than $80B in long-term debt to continue funding all the massive spending. If inflation expectations stay low, maybe the market will have enough firepower to ingest some of the new debt, but not all of it. With the Fed planning to begin tapering at the end of the year, someone will need to fill the $80 billion void. This does not even take into account the possibility of shrinking the Fed balance sheet, which should be considered impossible at this point.
The chart of the international holders above brings to mind the image of the Wiley Coyote running off a cliff. With 10-year interest rates hovering near 1.5%, one could argue there is strong demand for long-term Treasury debt. Unfortunately, foreign creditors have turned off their debt purchases. It took decades for them to accumulate ~$7T in Treasury debt. The Fed alone has accumulated more than half that (~$4.5T) over the last decade. The Fed is making the market seem strong, but as shown above, there might be nothing but air if they were to exit the market. With a thumb on the scale, no one is getting an accurate reading of true demand for US long-term debt.

Source – Warner Brothers
What about short-term debt markets?
As highlighted several times, the demand for short-term debt seems to remain very strong. This makes sense as T-Bills mature in less than a year, so these investments are perceived as nearly risk-free. In fact, it could be argued that the recent Treasury Bill issuance hiatus (Figure 1 – blue bars turning negative) could be causing stress in the Reverse Repo market. The chart below shows the current Reverse Repo market. Based on past quarter-end data, it’s very possible that Reverse Repos could exceed $1.5T by this coming Wednesday, June 30, before coming back down.
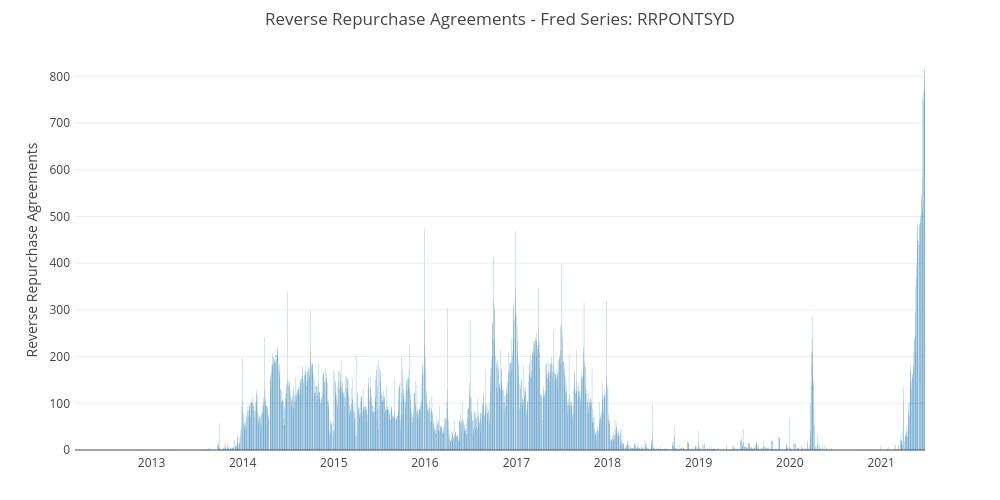
Source – https://fred.stlouisfed.org/series/RRPONTSYD
Many articles have been written to explain this phenomenon, without providing exact clarity on what’s actually going on. The current understanding seems to be that the banks are awash with cash – so much cash, they are hitting the limits in terms of how much cash they can hold on balance overnight. This is cash that should be invested on behalf of money market funds. But with so much cash in the system, if it were to all be invested in short-term debt instruments, it could drive rates negative. To avoid negative rates, the Fed is lending banks assets on its balance sheet overnight in exchange for cash. It is critical to avoid negative rates to insure money market funds never experience a loss and result in breaking the buck.
Maybe this is a leap too far, but it seems another solution to the Fed reverse repurchase activity could be for the Treasury to issue more short-term debt. So, why has the Treasury been drawing down its cash balance and letting short-term debt mature when there seems to be strong demand in the market? The Treasury must recognize the risk of having too much debt in short-term instruments and is trying to lengthen the duration of its debt outstanding. Unfortunately, this abundance of cash in the repo market is in search of low-risk short-term debt so will not provide demand for long-term debt.
If this is the case, it has created quite the pickle for the Treasury. By issuing too much short-term debt, the Treasury is by default putting pressure on the Fed to not raise short-term interest rates. However, by issuing too much long-term debt, the Treasury is by default putting pressure on the Fed to maintain or even increase quantitative easing. To reiterate, this is why it is imperative the market believes inflation is transitory. The Treasury cannot stop issuing debt, which leaves the Fed unable to raise rates or taper QE without wreaking havoc in the bond market. Additionally, if the Fed has to fight inflation, then it’s not just the Treasury facing its Wiley Coyote moment, but the entire US economy.
Wrapping up
With the economy reopening, the Treasury deployed its cash balance at the most opportune time, unless of course inflation numbers continue to increase (which based on all the data, anecdotal evidence, and liquidity in the repo market seems like a strong possibility). Unfortunately for the Fed, the Treasury will have to begin re-issuing debt again. Will it lean towards short-term debt hoping the Fed keeps interest rates low, or long-term debt hoping the Fed will expand QE?
But Fed may be constrained either way because it has its own problem. Powell must be praying that inflation readings come in low AND job numbers disappoint. If both don’t occur, then tough questions will be asked to justify more stimulus. Yellen and Powell may be best buds, but simple coordination will not be enough. They will need magic and luck to keep the course steady heading into 2H 2021 and 2022.
If the Fed is lucky enough to get low inflation readings out of its rigged CPI, it may provide cover to begin tapering. Rising long-term rates won’t have the same compounding effect on inflation expectations in a “low” inflation environment. Unfortunately, long-term rates will not be tenable over the medium term as the government has to finance more and more debt. As the market this year has indicated, when issuance surpasses Fed buying, rates have gone up. So what happens to rates when the Fed leaves the market entirely? Presumably, they go up a lot. How high will the Fed let rates go before re-entering?
Just because something is inevitable (US Debt spiral) does not make it imminent; however, the next six months of data may shine a bright light on all the irresponsibility over the last 12 years if inflation proves not so transitory. Chances are, the only thing transitory will be “talking about talking about” tapering.
US Debt interactive charts and graphs can always be found on the Exploring Finance dashboard: https://exploringfinance.shinyapps.io/USDebt/

Join the community.

McMaken: The Fed’s Inflation Is Behind the Supply-Chain Mess

‘White People, You Are The Problem’: AT&T’s Internal ‘Racial Reeducation Program’ Leaked

Matrix? Misdirection? Cringe? Zuckerberg’s presentation of future life in ‘metaverse’ sparks fear, loathing, marvel and mockery

New York facing streets without cops because of COVID vaccine mandate

The Establishment Is Hiding Mass Resistance To Vaccine Mandates With The “Striketober” Farce
