Economy
Do These Money Supply Charts Portend Hyperinflation?
Will the Fed be able to control future inflation and shrink its balance sheet back to a reasonable size?
The Federal Reserve responded to the 2020 coronavirus outbreak and lockdowns with an unprecedented expansion of the money supply. In many cases, overly expansionary monetary policy has historically led to high rates of inflation and economic collapse. Will the United States experience the same fate of high inflation and economic collapse?
Explosion of the Money Supply
The economic downturn in the first half of 2020 was massive, as was the Fed’s response. US economic production, measured as real gross domestic product (GDP), fell by an annualized rate of 31.4% in the second quarter, the fastest ever recorded. The Fed quickly took action by cutting its interest rate targets to almost zero and by greatly expanding the supply of base money.
These factors led to a huge jump in the broader money supply. Figure 1 shows the 12-month changes in the M2 since 1982. In 2020, M2 increased by almost $4 trillion, by far the largest expansion in US history.
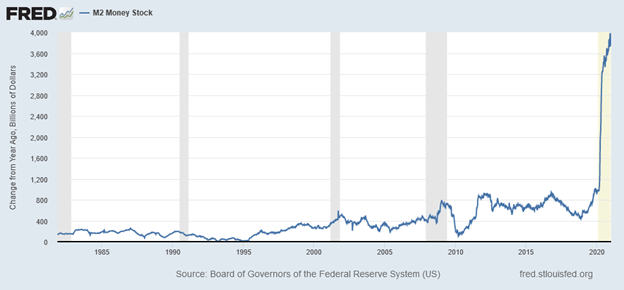
Some economic forecasters predict this unparalleled money expansion will lead to inflation and asset bubbles. Indeed, rapid monetary expansions have led to hyperinflation and economic collapse in a number of countries. Many believe the Fed’s overly expansive policies created asset price bubbles in the United States in the 1920s, 1990s, and early 2000s.
However, similar claims following the 2008 financial crisis were eventually proven false. Instead of high inflation and price bubbles, the economy experienced a decade of low inflation and subpar economic growth. Perhaps these lesser evils are the more likely outcome of our current predicament.
Where’s the Inflation?
Despite a massive increase in the money supply, market measures of expected inflation remain relatively mild. Figure 2 shows the financial markets’ predictions of the average rates of inflation expected over the coming 5 years, measured as the spread between the yields on 5-year US Treasuries and Treasury Inflation Protected Securities (TIPS). Inflation expectations fell in March and slowly recovered over the summer, reaching 1.95% by the end of 2020. These market rates indicate that high inflation is not coming soon, at least not in the next 5 years.

Why hasn’t the massive monetary expansion boosted inflation expectations? Let’s look at changes in the components of M2 and discuss why they might or might not lead to higher expected inflation.
What’s Driving Changes in the Money Supply?
Figure 3 shows the levels of M2 and its major components from the start of 2015 to the end of 2020. There are two things to notice about in the blue line representing M2. First, the increase in the level of M2 is much less dramatic than the change in M2 shown in Figure 1. Even though change in 2020 is unprecedented historically, it appears much smaller relative to the current total quantity of M2. Second, we see that most of the 2020 increase occurs in March and April. Since April, the growth rate has been only slightly higher than the pre-2020 average.

Figure 3 also shows the major components of M2: currency, bank deposits, and retail money market funds. It appears that the change in M2 is almost completely driven by the increase in deposits. Currency and retail money funds show similar patterns but on much smaller scales.
This, of course, begs the question: What is driving the increase in deposits?
To answer this question, let’s have a closer look at the Fed’s monetary policies. The Fed has two main tools for influencing the money supply: targeting interest rates, mostly through the interest it pays on bank reserves, and the purchase and sale of securities, known as “open market operations.” These two tools, however, can have very different effects on the money supply and the financial system.
When it buys bonds from the open market, the Fed injects money into the financial system. In the past, the Fed also used this tool to push interest rates up or down. Since 2008, however, the rate of interest on reserves has become the Fed’s main tool for influencing interest rates, while open market operations are used to add or remove money from the banking system.
Open Market Operations
Figure 4 shows the Fed’s securities holdings from 2015 through 2020, as well as total deposits in the banking system and the M2 measure of the money supply. The Fed’s open market purchases appear to be the main driver of the expansion of deposits and the money supply.
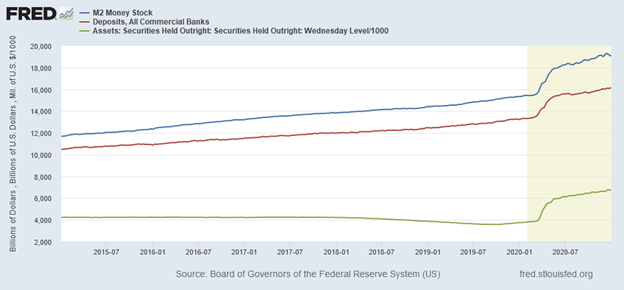
Deposits and M2 were growing steadily through early 2020, while Fed securities holdings were stable and actually falling in 2018 and 2019. During the economic downturn in March and April of 2020, the Fed began its massive monetary expansion by purchasing $2 trillion in Treasuries and mortgage-backed securities. Since then, it has continued its open market purchases but at a slower pace of $160 billion per month. The Fed’s purchases account for almost all of the increase in deposits and most of the increase in M2 during 2020.
Interest Rates and Bank Lending
While open market operations do add money directly to the banking system, the Fed’s interest rate policies normally have larger effects on the money supply due to the money multiplier effect. Reducing interest rates makes it more profitable for banks to lend. New loans increase the bank’s total assets and also create new money for the borrowers, which increases total deposits and the money supply. When this new money is spent it creates deposits at another bank which it in turn can use to create new loans. This process is repeated, which “multiplies” the effect of new deposits throughout the banking system.
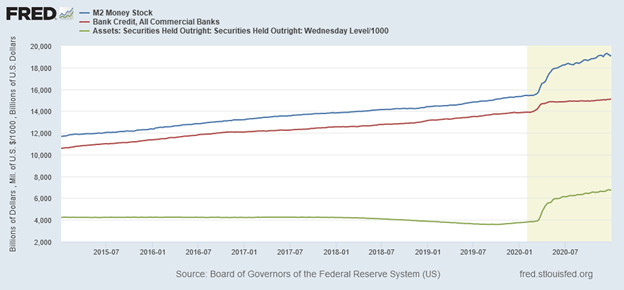
Historically, the money multiplier caused the total increase in the money supply to be much larger than the direct monetary injection from the Fed’s open market purchases. However, that has not been the case in 2020. Figure 5 shows M2 and the Fed’s securities holdings since the start of 2015 as well as total bank credit, which includes all lending such as home mortgages, business loans, and credit cards. Bank credit does show a modest bump in March of 2020, but it remains mostly flat thereafter. The March increase was likely from borrowing by businesses that needed cash to survive the lockdown period rather than supporting growth or expansion.
Why hasn’t the increase in deposits been accompanied by an increase in lending? One potential explanation is that demand for loans has been low, but evidence for this theory is mixed at best. Demand for commercial and industrial as well as construction and commercial real estate loans remains depressed as the economic recovery seems to have stalled. This problem is largely concentrated in states with more serious lockdowns and business restrictions, while the economies of states with fewer restrictions have largely recovered. Demand for auto loans and credit cards fell during the summer but have since rebounded. But demand for home mortgages is up and new home sales actually spiked during the summer.
The bigger problem may be the limited supply of loans. Banks are hesitant to lend because of economic uncertainty but also because the Fed is paying them not to lend. When the Fed pays interest on banks’ excess reserves, it gives banks the incentive to hold more reserves and make fewer loans. The higher the rate it pays on reserves (relative to the rate on short-term risk-free securities), the less banks are likely to lend.
Following the 2008 financial crisis, the Fed used the rate of interest on reserves to sterilize its quantitative easing (QE) purchases. From 2008 to 2014, the Fed purchased more than $3.5 trillion in Treasuries and mortgage-backed securities. Rather than stimulating excess production and inflation as many economists expected, the high rates of interest on reserves caused these funds to be absorbed by banks as excess reserves. This had the benefit of preventing excessive inflation, but it also slowed the rate of GDP growth, which averaged just 2.2%, a full percentage point below the US post-war average.
Can the Fed Do it Again, or Is Inflation Inevitable?
Given these enormous expansions of the money supply, some might believe that inflation is inevitable. Recent history indicates it is not. After trillions of dollars in QE from 2008 to 2014, the Fed was able not only to prevent runaway inflation but also to shrink its balance sheet over time.
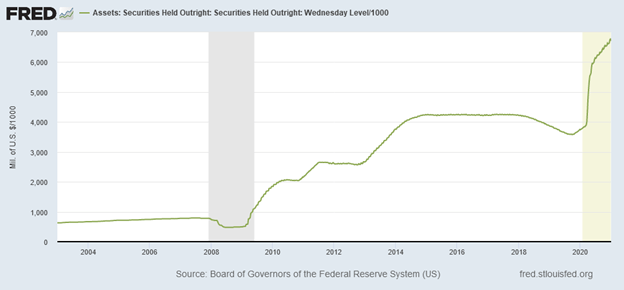
Figure 6 shows the Fed’s balance sheet from 2003 through the end of 2020. The Fed grew massively from late 2008 through 2014 and again in 2020, but its total assets did stabilize and then decline from 2014 through late 2019. From December 2017 to September 2019, the balance sheet declined by $700 billion, about 15.5%. This was done not through the traditional method of selling securities but simply by allowing some of its bond holdings to mature, which slowly pared down the size of its balance sheet.
Will the Fed be able to control future inflation and shrink its balance sheet back to a reasonable size? It has the tools to accomplish this goal by paying higher interest on reserves. If inflation picks up, the Fed can limit the damage by simply raising interest rates.
But no one knows for sure if Fed officials will choose to do so. Over the past decade, constraining inflation came at the cost of reducing bank lending and economic growth. The Fed now faces a similar dilemma but with an even larger balance sheet than in 2014. Will Fed officials have the political will to raise interest rates and limit inflation before the economy reaches “full employment,” the current political rally cry?
There are also other economic factors and problems of political economy. The United States could experience a double-dip recession, in which case the Fed might increase its open market purchases. Having already abandoned the promises by prior Fed chairs to avoid credit allocation, future Fed chairs may face renewed political pressure to bail out nonbank companies and state and local governments. Such actions would further expand the Fed’s balance sheet, making it more difficult to reduce its size and control inflation.
Financial markets indicators suggest that high inflation is not likely. Even with a very large balance sheet, the Fed has proven that it can control inflation by paying high rates of interest on bank reserves. Whether Fed officials choose to do so is the open question.


Economy
McMaken: The Fed’s Inflation Is Behind the Supply-Chain Mess
… the idea that supply chain problems are “driving inflation” gets the causation backward.

It seems supporters of the Biden Administration finally settled on a narrative they like for explaining away supply chain shortages.
Here’s the administration’s talking point: the US economy is rolling along so well that Americans are demanding huge amounts of goods. That’s overwhelming the supply chain and causing the back-ups roiling America’s ports and logistic infrastructure.
For example, Transportation Secretary Buttigieg this month declared “Demand is up … because income is up, because the president has successfully guided this economy out of the teeth of a terrifying recession.”
Similarly, White House spokeswoman Jen Psaki told reporters supply chain problems are occurring because “people have more money … their wages are up…“we’ve seen an economic recovery that is underway…”
This position has been mocked by a number of conservative politicians—including Senator Ted Cruz—and commentators who find this to be an absurd assumption.
Yet, the administrator’s defenders aren’t totally wrong. As Mihai Macovei showed earlier this month, the global volume of trade and shipping volume in 2021 have actually exceeded pre-pandemic numbers. For example, in the port of Los Angeles, “loaded imports” and “total imports” for the 2020-2021 fiscal year (ending June 30, 2021) were both up when compared to the same period of the 2018-2019 fiscal year.
In other words, it’s not as if nothing’s moving through these ports. In fact, more is moving through them than ever before. That suggests demand is indeed higher.
But why is it higher? It some ways, it’s true that, as Psaki says, people have more money.
But that’s where the veracity and usefulness of Biden’s defenders end in explaining the problem.
Much of the answer can be found in monetary inflation. Obviously, Joe Biden hasn’t “successfully guided the economy” through anything, but it is accurate to say that people have more money in a nominal sense. Wages are up nominally. After all, if we look at the immense amount of new money created over the past 18 months, we should absolutely expect people to have more money sloshing around. But this also means a lot more pressure on the logistical infrastructure as people buy up more consumer goods.
In other words, the idea that supply chain problems are “driving inflation” gets the causation backward. It’s money-supply inflation that’s causing much of the supply chain’s problems. Not the other way around.
After all, since February 2020, M2 has increased from $15.2 trillion to $20.9 trillion in September 2021. That’s an increase of 35 percent. Yes, some of that has been kept within the banking system through the Fed’s payment of interest on reserves, but a lot of it clearly has entered the “real economy” through stimulus payments, unemployment insurance, and federal deficit spending in general.
Originally, the public was saving a lot of that stimulus and bailout money, with the personal savings rate hitting historic highs of over 25 percent. But this past summer the savings rate collapsed again, and as of September is back under eight percent. The public is now flooding the economy with its former savings.
The American appetite for spending on consumer goods hasn’t gone away. Yet, there are many reasons to suspect this spending spree is unsupported by actual economic activity, and in a phenomenon of monetary inflation.
For example, today’s tsunami of spending raises questions when we consider there are still about five million fewer people working in the American economy than was the case in early 2020. That means fewer people being paid wages. Without monetary inflation, an economy with millions of fewer workers suggests there should be less spending.
Additionally, spending increases when the public suspects that inflation is going to increase. That is, if there is perception the value of money will decline, the demand for money will decline also. As Ludwig von Mises noted: “once public opinion is convinced … the prices of all commodities and services will not cease to rise, everybody becomes eager to buy as much as possible and to restrict his cash holding to a minimum size.”
That means more spending. This phenomenon is already clear in home prices and grocery prices. The public may suspect rising prices are here to stay. Meanwhile, the Consumer Price Index—a very limited measure of goods-price inflation—is nonetheless near a 35-year high. That means now’s a good time to spend.
With 2020’s panic-induced saving subsiding, people are now wondering if their savings produce any returns. But ordinary savers are surely now remembering that the interest returns from savings right now are next to nothing. Thanks to the central bank’s ultra-low interest rate policy, we live in a yield-starved world. That’s OK for hedge funders who can participate in carry trades and other high-yield forms of investment. But for regular people they’re stuck with interest rates that don’t keep up with price inflation. So it makes more sense to spend dollars rather than save them.
So, Biden’s people are correct in a certain sense that people have “more money” and that “demand is up.” With federal spending hitting historic highs—and half of it is deficit spending that’s being monetized—we should expect people to have “more money.” This is just what we would expect in an inflationary environment. We should expect demand for everything (but money) to be up.
The question, however, is how much of this windfall will continue in real, inflation-adjusted terms. It’s too early to tell, although we can also see that inflation-adjusted median earnings collapsed 6.3 percent, year over year, during the second quarter of 2021. We can see that real GDP growth has dramatically slowed.
But at least as far as the third quarter is concerned, it’s fairly clear the US was—and likely still is—in the midst of an inflationary boom. But how long will it last?
Economy
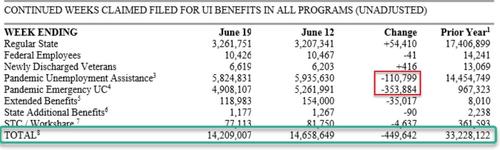
There Are Still Over 14 Million Americans On Some Form Of Government Dole
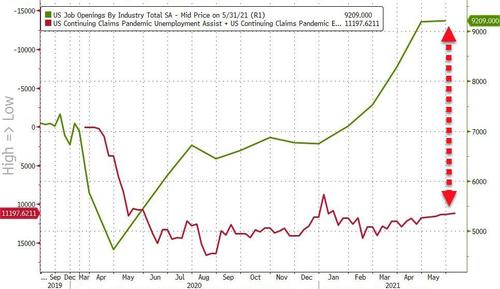
… we remind readers of the gaping chasm between those still claiming some form of pandemic-related unemployment benefit and the record number of job openings in America currently…

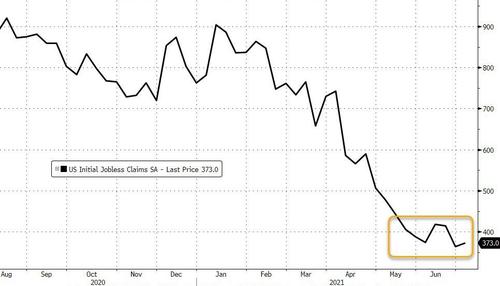
Initial jobless claims hovered at post-COVID-lockdown lows but were disappointing at 373k – well above the 200k-ish norms of pre-COVID
Source: Bloomberg
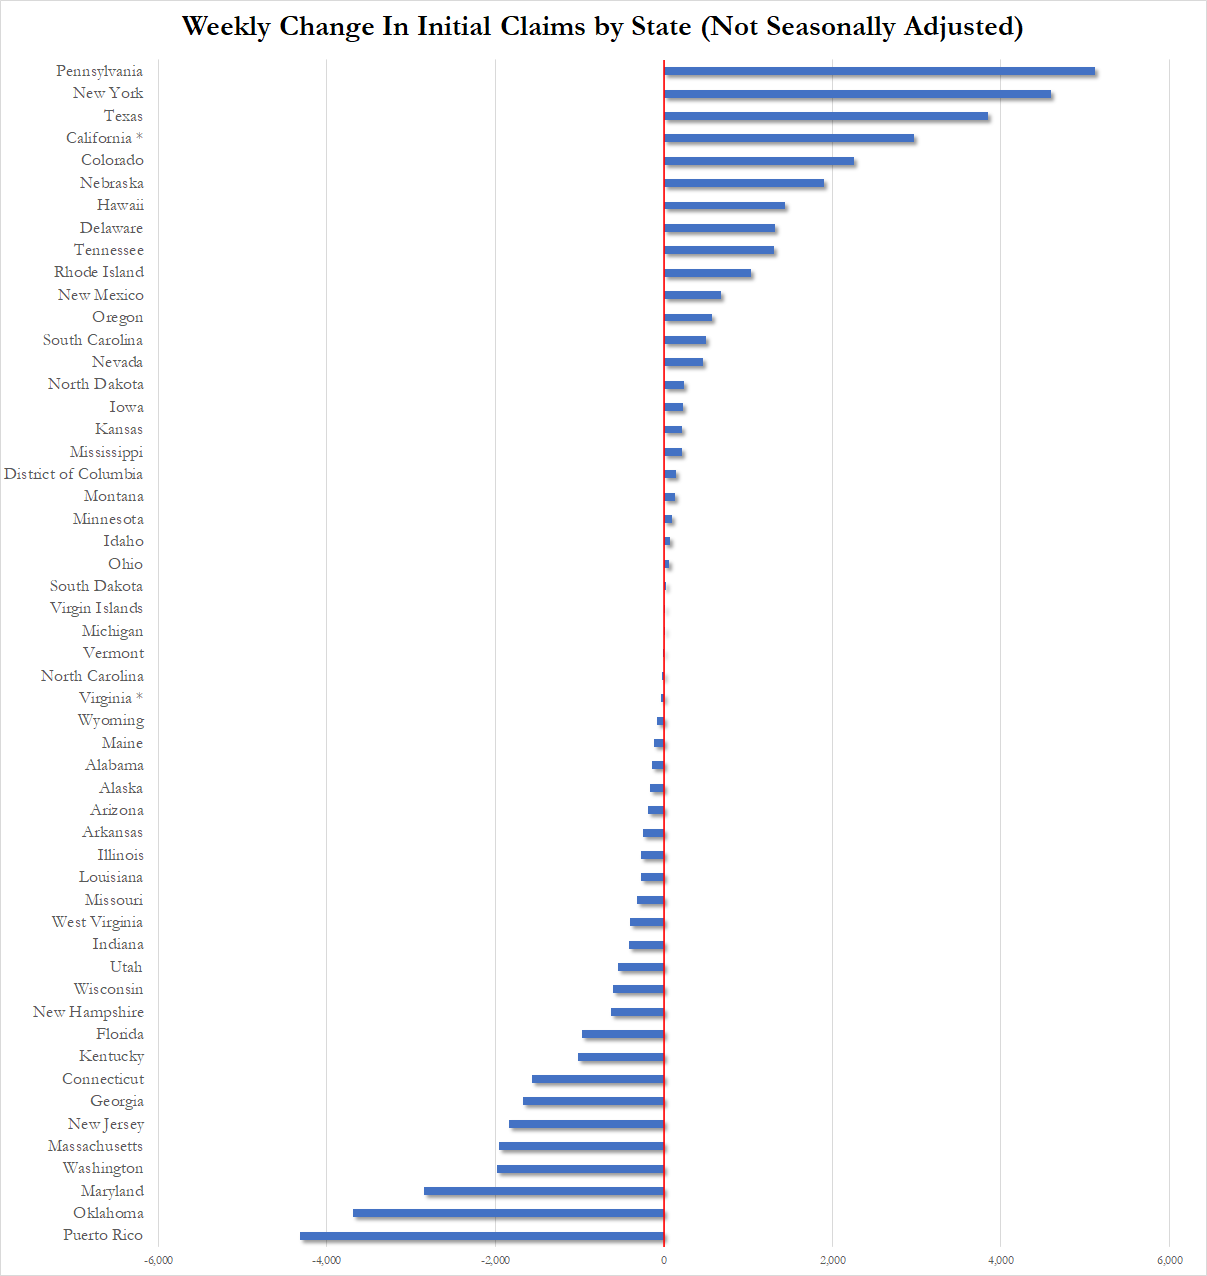
Notably, California and Virginia ‘estimated’ their jobless claims last week and Pennsylvania continues to swing wildly from week to week…

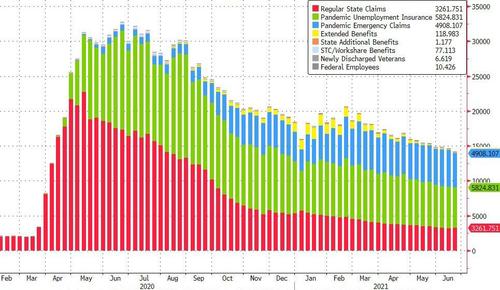
But, while the picture is improving overall, we should still remember that there are over 14 million Americans still on some of government dole…
Source: Bloomberg
We do note that 460k Americans dropped off the pandemic emergency aid rolls…
Finally, we remind readers of the gaping chasm between those still claiming some form of pandemic-related unemployment benefit and the record number of job openings in America currently…
Source: Bloomberg
Tick-tock on those benefits.
Economy
The Fed in a Box Part 2: They Cannot End Quantitative Easing
If inflation doesn’t slow in the coming months, the Fed may be forced to step in.
- If the Fed tapers QE, it may reveal waning appetite for long-term treasuries
- The Treasury may have used its cash balance reserve to anchor inflation expectations
- If inflation persists, the Fed may have to increase rather than decrease QE
Note: By definition, inflation is an expansion of the money supply. In this article, inflation will be used interchangeably with rising prices (usually as a result of money supply expansion)
Introduction
When the economy was shut down in March 2020, the government responded with massive fiscal and monetary support. The fiscal stimulus totaled $4T+ in relief packages. All of this spending was paid for with debt issued by the Treasury. The Treasury mostly issued short-term debt. With rates being held at zero by the Fed, and strong demand for short-term debt, it made sense to quickly raise cash using Treasury Bills as interest-free loans.
The Fed monetary policy was two fold, slash short-term rates to zero and inject $1.5 trillion into the long-term debt treasury market. The effect was to bring down interest rates across the entire yield curve. After the initial debt binge, QE went on auto-pilot, with the central bank buying about $80B a month in long-term debt (plus another $40B in Mortgage debt). Over the last year, the Treasury has continued to issue long-term debt, averaging more than the $80B the Fed has been buying. This has caused long-term rates to rise.
All of this fiscal and monetary stimulus is not without cost. Historically this type of activity almost always leads to higher inflation. The Fed may have recently indicated it wants higher inflation, but this is not true. This stance simply provides cover for them to not act in the face of rising prices. To actually fight inflation, the Fed would have to increase short-term rates above the rate of inflation. Part 1 of this series went into detail about how US short-term debt has doubled from $2.5T to $4.5T. This makes even small changes in short-term rates an immediate risk to the federal government, not to mention the much higher rates needed in a true inflation fight.
In theory, the Fed could leave short-term rates at 0% while ending QE and even shrinking its balance sheet. This would push long-term rates up to combat inflation. In the short/medium term the Treasury can mathematically handle higher long-term rates because it takes time for the higher rates to work their way through long-term debt. See the chart below that shows how the last tightening cycle worked its way through the average interest rate across debt instrument. Specifically, look at Notes compared to Bills. The average weighted interest rate on Bills moved very quickly where the rate on Notes barely had time to increase before rates dropped again.
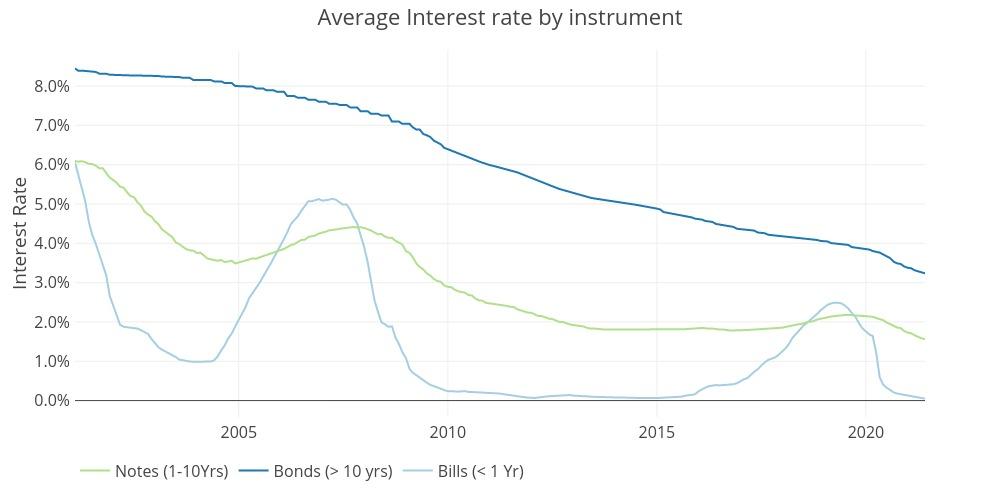
Source – Treasurydirect.gov
Although the Treasury could handle rising long-term rates (even if the economy and mortgage market cannot), the Fed has another problem. Rising long-term rates send an important message: rising inflation expectations. While inflation is first and foremost a result of monetary policy, higher inflation expectations quickly exacerbate the problem. This is why the Fed has been messaging they are OK with higher inflation and also why they have been pounding the table that inflation is transitory. They need to keep inflation expectations low! If inflation expectations were to rise, especially at this critical juncture, it would be game over for the Fed, as they would have to raise short-term rates (devastating the Treasury and economy) in order to save the dollar and squash inflation.
With the economy opening up in March of this year, things were getting very precarious as inflation was rapidly rising along with surging long-term rates. Remember that rising long-term rates indicate rising inflation expectations. This could cause transitory inflation to be much less transitory.
In summer 2020, the Treasury issued enough debt to build up a significant cash reserve. In response to rising long-term rates in Q1 2021, it appears the Treasury strategically used its cash reserves to slow down the issuance of long-term debt. With total short-term debt outstanding already so high, the cash balance gave the Treasury ammunition to decrease debt issuance just as a $1.9T stimulus bill was passed and inflation was set to explode higher. This would have been perfect timing to support the Feds narrative that inflation is transitory to keep expectations from snowballing out of control.
If inflation doesn’t slow in the coming months, the Fed may be forced to step in. With the Treasury poised to issue more debt, it can no longer rely on its one-time use of excess cash reserves. This will put more pressure on the Fed to clamp down long-term rates by increasing rather than decreasing QE. Yes, the Fed may decide to print more money (leading to higher prices) to fight rising inflation expectations (higher long-term interest rates).
Understanding recent fiscal and monetary maneuvers
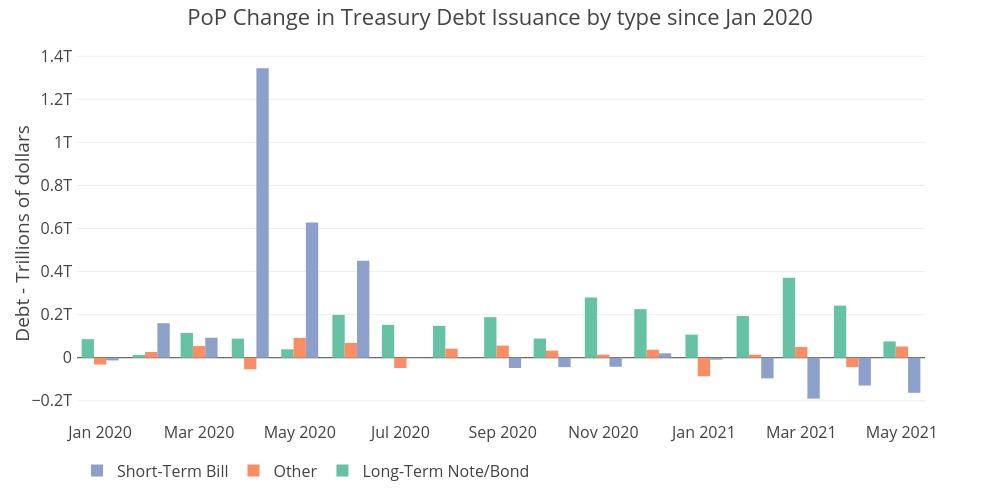
Last year, when the pandemic hit, the US Government started spending trillions of dollars. Massive spending plans were approved in the name of stimulus and COVID relief. Because the government does not have much money on hand, and taxes cannot quickly be raised, the Treasury issued trillions in debt. The markets can easily absorb short-term US Treasury Bills, so when the Fed abruptly cut rates to 0%, the Treasury responded by issuing short-term debt to the tune of $2.4T from March to June 2020. See figure 1 below.
Source – Treasurydirect.gov
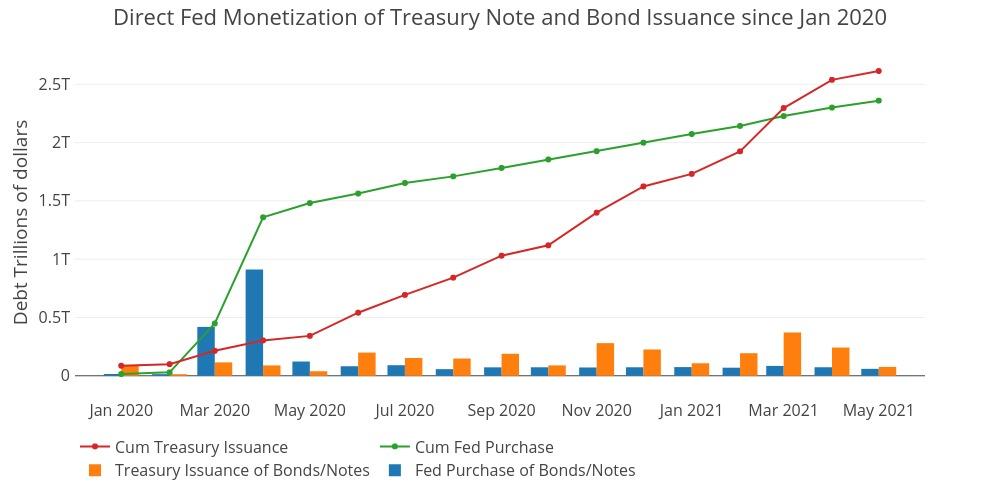
In tandem, the Fed bought up trillions of dollars in US Debt, but the Fed was buying on the long end of the curve while the Treasury was issuing debt on the short end. This caused long-term rates to collapse. The Fed purchased enough long-term debt to absorb more than a year’s worth of long-term debt issuance. The chart below shows how the month over month and cumulative change in the Feds balance sheet compared to the Treasury Debt Issuance of long-term notes and bonds.
Source – Treasurydirect.gov
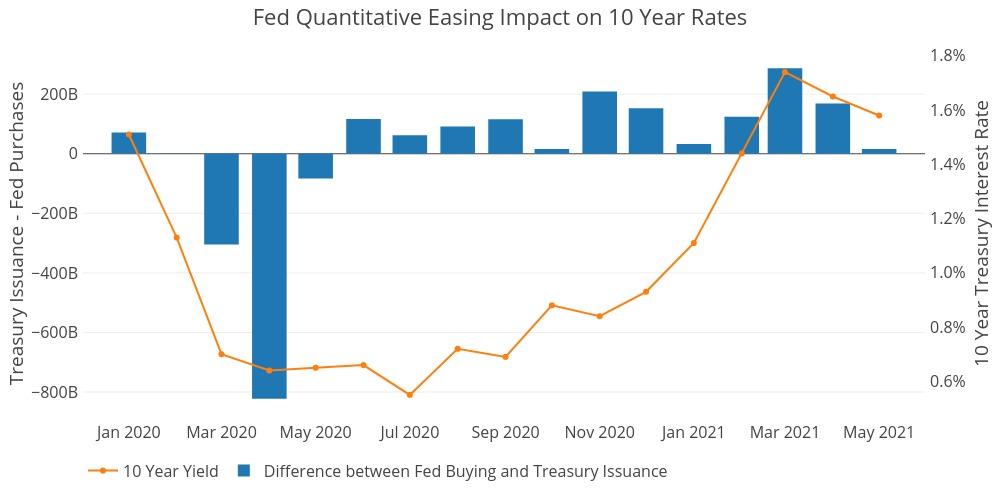
This action by the Fed had a massive impact on long-term rates. The chart below shows the difference between the two bars above, specifically the difference in Fed Buying and Treasury issuance of long-term debt for each individual month since Jan 2020. These values are not cumulative. The right Y-Axis shows the month-end interest rate of the 10-year bond. Looking at this chart shows something extremely clear: When the Fed buying exceeds debt issuance, rates are flat or falling; however when long-term debt issuance surpasses the Fed’s buying, rates rise.
Source – Treasurydirect.gov
The impact of the Fed can first be seen as interest rates fell from 1.5% to .6% during the initial buying spree. After the initial burst, the Fed put QE on auto-pilot, buying “only” $80B a month in long-term Treasuries. However, because the Treasury was issuing more than $80B a month as depicted by the positive bars starting in June 2020, interest rates started rising.
This trend started to accelerate in November of 2020, as long-term debt issuance was outpacing Fed Buying by around $200B. Things really started to escalate in the first quarter of 2021 as Treasury Debt issuance surpassed Fed buying by $286B in March right as interest rates were crossing above 1.7%.
Then, suddenly, long-term debt issuance started falling in April and was almost even with Fed buying in May. This consequently led to a fall in long-term rates, which are now hovering back around 1.5%. How did this happen just as Biden was pushing through a $1.9 stimulus package? Unlike 2020, when short-term debt issuance was used to plug the gap, Figure 1 above shows that short-term debt issuance was actually turning negative (blue bars).
What gives?
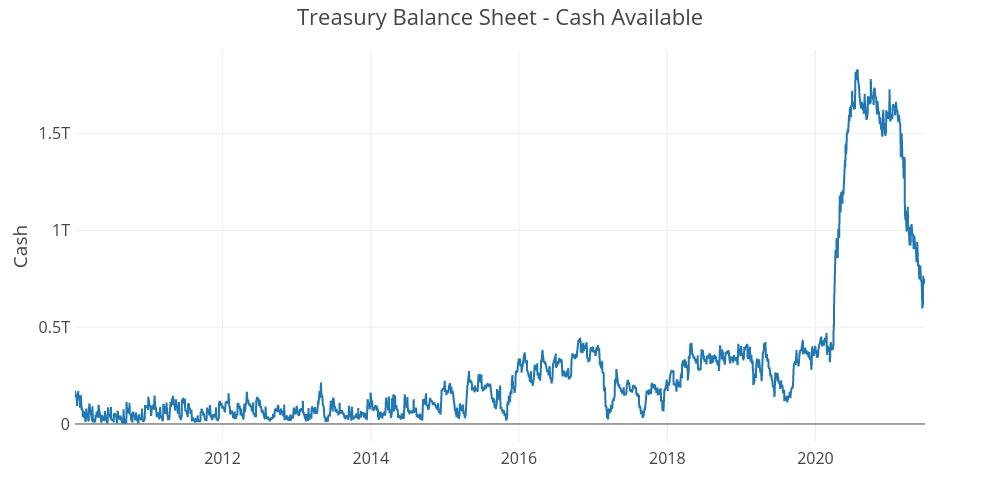
One look at the Treasury Cash Balance sheet in the chart below tells almost the entire story. This was first highlighted by a SchiffGold article published June 16. The chart below shows a massive surge in cash reserves by the treasury last year. Since March of this year, the cash balance has plummeted by over $1T.
Source – Treasurydirect.gov
Inflation Expectations
Why such a massive and sudden drawdown in the cash balance? In truth, there could be lots of reasons, but it does seem extremely sudden. One would think the Treasury, led by Yellen, would be very deliberate and thoughtful about how to use up $1T+ in dry powder. For the past 3 months, the Fed has been shouting from the rooftops that inflation is transitory. At the June FOMC press conference, Powell stood up and explained how long-term inflation expectations remain well-anchored. A proxy for inflation expectations is long-term interest rates.
Had interest rates continued to rise similar to the recent trajectory (climbing from .8% in Nov to 1.7% in March), this would have been a difficult narrative to push. The Fed needs inflation expectations to remain in check or else inflation will be anything but transitory. Thus, the perfect time for the Treasury to pause issuance of long-term debt would be April-June 2021 just as the economy is re-opening and the Fed is forecasting inflation to be at its worst before coming back down.
While this is speculation, it would be a very strategic move from both Powell and Yellen. Regardless of the intention though, the problem is that the Treasury has now spent its large cash balance. It could return to the short-term debt market, but the outstanding balance is still sitting above $4T (see part 1). It needs to be converting that short-term debt to long-term debt while long-term interest rates are still low and the Fed is still buying. But the Fed is simply not buying enough at $80B to convert all that debt!
If inflation persists beyond a few months, then interest rates are going to rise in a hurry as the market demands higher rates. Adding fuel to the fire will be the Treasury debt issuance overwhelming the $80B Fed buying as it did from November to March.
Then what?
Who is absorbing the long-term debt to keep interest rates from returning to the upward trajectory from Aug 2020 – Mar 2021?
International creditors have had little appetite for US Debt lately. The chart below shows the total outstanding debt held by foreign governments. In the past 15 months, while the Treasury has issued over $4T in new debt, the net amount bought by foreign governments is close to zero.
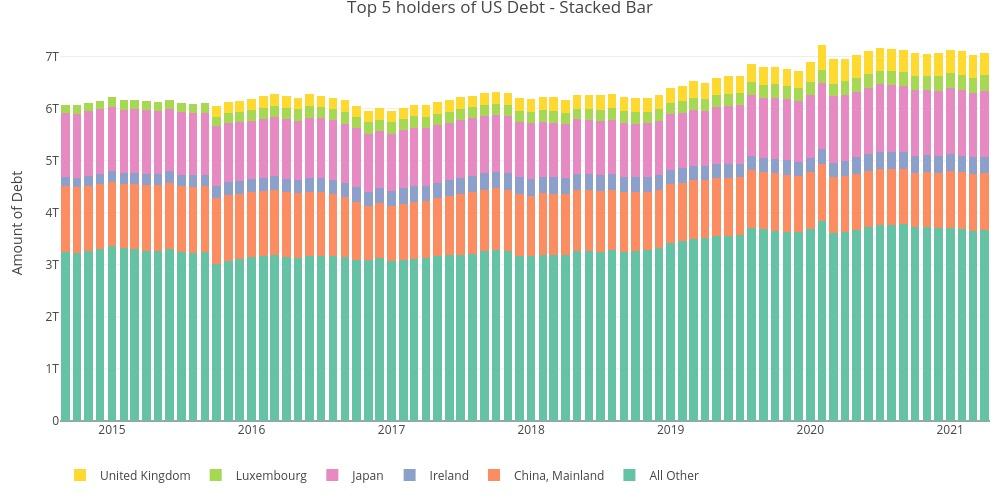
Source – https://ticdata.treasury.gov/Publish/mfh.txt
To zoom into the exact amount of change since the massive debt issuance, see the chart below. In total, foreign creditors have absorbed $120 billion of $6T+ or less than 2% of total issuance!
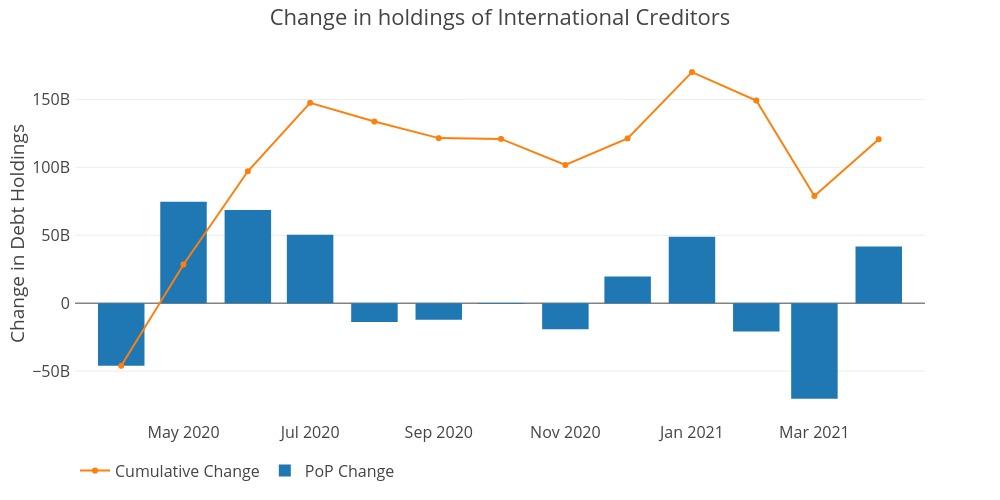
Source – https://ticdata.treasury.gov/Publish/mfh.txt
How are rates going to stay low if the Fed keeps the treasury buying cap at $80B? The Treasury will have to issue more than $80B in long-term debt to continue funding all the massive spending. If inflation expectations stay low, maybe the market will have enough firepower to ingest some of the new debt, but not all of it. With the Fed planning to begin tapering at the end of the year, someone will need to fill the $80 billion void. This does not even take into account the possibility of shrinking the Fed balance sheet, which should be considered impossible at this point.
The chart of the international holders above brings to mind the image of the Wiley Coyote running off a cliff. With 10-year interest rates hovering near 1.5%, one could argue there is strong demand for long-term Treasury debt. Unfortunately, foreign creditors have turned off their debt purchases. It took decades for them to accumulate ~$7T in Treasury debt. The Fed alone has accumulated more than half that (~$4.5T) over the last decade. The Fed is making the market seem strong, but as shown above, there might be nothing but air if they were to exit the market. With a thumb on the scale, no one is getting an accurate reading of true demand for US long-term debt.

Source – Warner Brothers
What about short-term debt markets?
As highlighted several times, the demand for short-term debt seems to remain very strong. This makes sense as T-Bills mature in less than a year, so these investments are perceived as nearly risk-free. In fact, it could be argued that the recent Treasury Bill issuance hiatus (Figure 1 – blue bars turning negative) could be causing stress in the Reverse Repo market. The chart below shows the current Reverse Repo market. Based on past quarter-end data, it’s very possible that Reverse Repos could exceed $1.5T by this coming Wednesday, June 30, before coming back down.
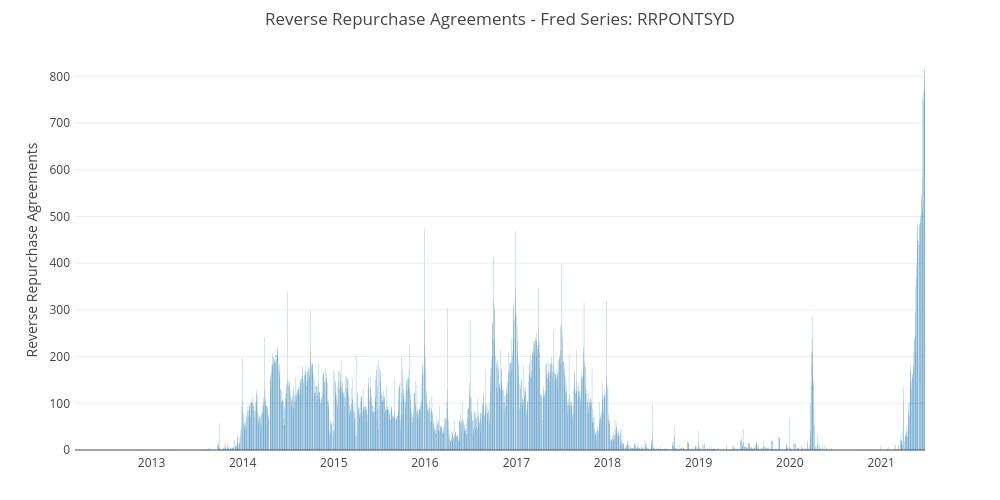
Source – https://fred.stlouisfed.org/series/RRPONTSYD
Many articles have been written to explain this phenomenon, without providing exact clarity on what’s actually going on. The current understanding seems to be that the banks are awash with cash – so much cash, they are hitting the limits in terms of how much cash they can hold on balance overnight. This is cash that should be invested on behalf of money market funds. But with so much cash in the system, if it were to all be invested in short-term debt instruments, it could drive rates negative. To avoid negative rates, the Fed is lending banks assets on its balance sheet overnight in exchange for cash. It is critical to avoid negative rates to insure money market funds never experience a loss and result in breaking the buck.
Maybe this is a leap too far, but it seems another solution to the Fed reverse repurchase activity could be for the Treasury to issue more short-term debt. So, why has the Treasury been drawing down its cash balance and letting short-term debt mature when there seems to be strong demand in the market? The Treasury must recognize the risk of having too much debt in short-term instruments and is trying to lengthen the duration of its debt outstanding. Unfortunately, this abundance of cash in the repo market is in search of low-risk short-term debt so will not provide demand for long-term debt.
If this is the case, it has created quite the pickle for the Treasury. By issuing too much short-term debt, the Treasury is by default putting pressure on the Fed to not raise short-term interest rates. However, by issuing too much long-term debt, the Treasury is by default putting pressure on the Fed to maintain or even increase quantitative easing. To reiterate, this is why it is imperative the market believes inflation is transitory. The Treasury cannot stop issuing debt, which leaves the Fed unable to raise rates or taper QE without wreaking havoc in the bond market. Additionally, if the Fed has to fight inflation, then it’s not just the Treasury facing its Wiley Coyote moment, but the entire US economy.
Wrapping up
With the economy reopening, the Treasury deployed its cash balance at the most opportune time, unless of course inflation numbers continue to increase (which based on all the data, anecdotal evidence, and liquidity in the repo market seems like a strong possibility). Unfortunately for the Fed, the Treasury will have to begin re-issuing debt again. Will it lean towards short-term debt hoping the Fed keeps interest rates low, or long-term debt hoping the Fed will expand QE?
But Fed may be constrained either way because it has its own problem. Powell must be praying that inflation readings come in low AND job numbers disappoint. If both don’t occur, then tough questions will be asked to justify more stimulus. Yellen and Powell may be best buds, but simple coordination will not be enough. They will need magic and luck to keep the course steady heading into 2H 2021 and 2022.
If the Fed is lucky enough to get low inflation readings out of its rigged CPI, it may provide cover to begin tapering. Rising long-term rates won’t have the same compounding effect on inflation expectations in a “low” inflation environment. Unfortunately, long-term rates will not be tenable over the medium term as the government has to finance more and more debt. As the market this year has indicated, when issuance surpasses Fed buying, rates have gone up. So what happens to rates when the Fed leaves the market entirely? Presumably, they go up a lot. How high will the Fed let rates go before re-entering?
Just because something is inevitable (US Debt spiral) does not make it imminent; however, the next six months of data may shine a bright light on all the irresponsibility over the last 12 years if inflation proves not so transitory. Chances are, the only thing transitory will be “talking about talking about” tapering.
US Debt interactive charts and graphs can always be found on the Exploring Finance dashboard: https://exploringfinance.shinyapps.io/USDebt/

Join the community.

McMaken: The Fed’s Inflation Is Behind the Supply-Chain Mess

‘White People, You Are The Problem’: AT&T’s Internal ‘Racial Reeducation Program’ Leaked

Matrix? Misdirection? Cringe? Zuckerberg’s presentation of future life in ‘metaverse’ sparks fear, loathing, marvel and mockery

New York facing streets without cops because of COVID vaccine mandate

The Establishment Is Hiding Mass Resistance To Vaccine Mandates With The “Striketober” Farce
